Analysis of T-s Diagrams for Ideal Gases
Discover a detailed explanation and solved example on the comprehensive analysis of T-s Diagrams for perfect gases, including an introduction to T-s diagrams, understanding perfect gases, processes on T-s diagrams, Rankine cycle basics, and a solved example problem. Explore the temperature-entropy variations in different thermodynamic processes and key components of the Rankine cycle, with insights on isentropic, isothermal, isobaric, and isochoric processes.
Download Presentation

Please find below an Image/Link to download the presentation.
The content on the website is provided AS IS for your information and personal use only. It may not be sold, licensed, or shared on other websites without obtaining consent from the author. If you encounter any issues during the download, it is possible that the publisher has removed the file from their server.
You are allowed to download the files provided on this website for personal or commercial use, subject to the condition that they are used lawfully. All files are the property of their respective owners.
The content on the website is provided AS IS for your information and personal use only. It may not be sold, licensed, or shared on other websites without obtaining consent from the author.
E N D
Presentation Transcript
C omprehensive Analysis of T-s Diagrams for Perfect G ases: Detailed Explanation with Solved Example
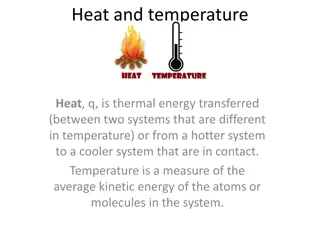
Introduction Introduction to to T T- -s s Diagrams Diagrams The temperature and entropy variations that occur throughout different thermodynamic processes are graphically represented by the T-s diagram, or temperature-entropy diagram. It is frequently used to examine various thermodynamic processes for ideal gases, such as refrigeration cycles and heat engines. In this diagram:- T represents temperature, expressed in Kelvin. Specific entropy (in J/kg K or kJ/kg K) is denoted by s. The area under a curve in a T-s diagram depicts the heat transfer (Q).
Understanding Perfect Gases A theoretical gas that obeys the ideal gas law at any temperature and pressure is called a perfect gas, sometimes known as an ideal gas. PV=nRT Where, P = Pressure of the gas V = Volume of the gas n = Number of moles of gas R = Universal gas constant (8.314 J/mol K) T = Absolute temperature in Kelvin.
Processes on T Processes on T- -s Diagrams s Diagrams Isentropic process: Process with no heat transfer (ds = 0). Shown as a vertical line on the T-s diagram. Isothermal process: Process with constant temperature (dT = 0). Shown as a horizontal line on the T-s diagram. Isobaric process: Process with constant pressure (dp = 0). Shown as an upward-sloping curve on the T-s diagram. Isochoric process: Process with constant volume (dv = 0). Shown as a downward-sloping curve on the T-s diagram.
Rankine Cycle Rankine Cycle The basic working principle of the majority of power plants, especially steam power plants, is the thermodynamic Rankine cycle. It explains the method mainly the expansion of steam by which thermal energy is transformed into mechanical work. Key Components of the Rankine Cycle: 1. Boiler 2. Turbine 3. Condenser 4. Pump
Example Problem Problem: A steam power plant operates on the Rankine cycle with the following conditions: - The steam enters the turbine at 4 MPa and 350 C. - The steam is exhausted from the turbine at 10 kPa. - Assume the condenser pressure is 10 kPa and the pump is ideal (isentropic). Determine the specific enthalpy and entropy at each point of the cycle, and plot the T-s diagram.
Solution Step 1: State 1 (Steam at the inlet of the turbine) We are given: Pressure: ?1=4 Mpa Temperature: ?1=350 ? Using steam tables : Specific enthalpy, h_1 3179 kJ/kg Specific entropy, s_1 6.7 kJ/kg K
Step 2: State 2 (Steam at the exit of the turbine) The steam expands isentropically (constant entropy) in the turbine, so: - s_2 = s_1 = 6.7 kJ/kg K - Pressure: P_2 = 10 kPa Using steam tables for 10 kPa, we find: - T_sat= 45.8 C - s_f 0.649 kJ/kg K (for liquid) - s_g 8.150 kJ/kg K (for vapor) Since s_2 is between s_f and s_g, the steam is in the wet region. We calculate the quality x_2 (the fraction of vapor in the mixture) using: Now, using the quality, we can calculate the specific enthalpy at state 2: h_2 = h_f + x_2 (h_g h_f) Where: h_f 191.81 kJ/kg (saturated liquid enthalpy at 10 kPa) h_g 2392.8 kJ/kg** (saturated vapor enthalpy at 10 kPa) Substituting values: h_2 = 191.81 + 0.78 (2392.8 191.81) =1916.5 kJ/kg
Step 3: State 3 (Condensed liquid after the condenser) Pressure: P_3 = 10 kPa As it is saturated liquid at 10 kPa, we use: h_3 = h_f 191.81 kJ/kg s_3 = s_f 0.649 kJ/kg K Step 4: State 4 (Water at the exit of the pump) The pump process is isentropic, so s_4 = s_3 . To find the enthalpy at state 4, we use the pump work equation. However, since the work required by the pump is small compared to the turbine, we can approximate the enthalpy: h_4 = h_3 + v (P_4 P_3) Where: v 0.00101 m /kg (specific volume of liquid at state 3) P_4 = 4 Mpa, P_3 = 10 kPa h_4 = 191.81 + 0.00101 (4000 10) 195.85 kJ/kg
Practical Example: Refrigeration Cycle A practical example of a T-s diagram can be seen in the vapor compression refrigeration cycle, used in air conditioners and refrigerators. The cycle involves four main processes: 1. Isentropic Compression (1-2): The refrigerant vapor is compressed in the compressor, raising its temperature and pressure without changing entropy (vertical line) 2. Isobaric Heat Rejection (2-3): The high-pressure refrigerant releases heat to the surroundings in the condenser, decreasing entropy as it condenses (curved line to the right). 3. Isenthalpic Expansion (3-4): The refrigerant expands in the expansion valve, dropping in temperature (vertical line down). 4. Isobaric Heat Absorption (4-1): The refrigerant absorbs heat in the evaporator, increasing entropy (curved line to the right).
Conclusion and Future Developments In conclusion, T-s diagrams are invaluable for analyzing perfect gases in thermodynamics. Future advancements in modeling and simulation techniques will enhance their applicability, making them even more relevant in modern engineering and scientific research.
Thanks! Any Questions?

