Analysis of Test Beam Data on Fascia by Florence Group
"Explore the analysis of test beam data on fascia conducted by Elena Vannuccini on behalf of the Florence group. The analysis includes tests on various particles, upgrades, ionization signals, and discrepancies between beam-test and MC data. Discover insights from beam-test vs. MC data comparisons and the behavior of ionization signals for different particles."

Download Presentation

Please find below an Image/Link to download the presentation.
The content on the website is provided AS IS for your information and personal use only. It may not be sold, licensed, or shared on other websites without obtaining consent from the author. If you encounter any issues during the download, it is possible that the publisher has removed the file from their server.
You are allowed to download the files provided on this website for personal or commercial use, subject to the condition that they are used lawfully. All files are the property of their respective owners.
The content on the website is provided AS IS for your information and personal use only. It may not be sold, licensed, or shared on other websites without obtaining consent from the author.
E N D
Presentation Transcript
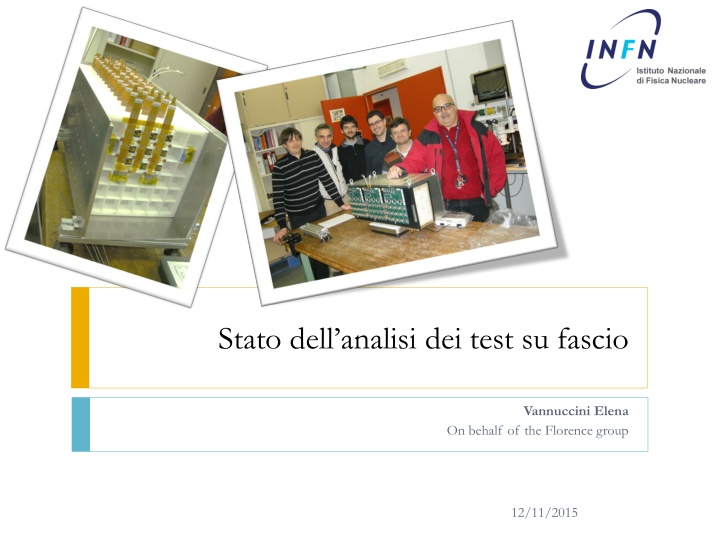
Stato dellanalisi dei test su fascio Vannuccini Elena On behalf of the Florence group 12/11/2015
Sommario test su fascio Feb 2013 Test su fascio all SPS del CERN (Pb+Be) Ioni A/Z=2 @13-30 GeV/u Prima versione del prototipo 14 piani Lug 2014 Test su fascio di elettroni alla BTF di Frascati Elettroni multipli 1 500 400 300 MeV Studio del regime di transizione di CASIS tra alto e basso guadagno e della dipendenza della risposta dalla tempistica del segnale Feb 2015 Test su fascio all SPS del CERN (Ar+Polyethylene) Ioni A/Z=2 @19-30 GeV/u Upgrade: cristalli schermati per eliminare cross-talk ottico + 15 piano equipaggiato con cristalleria Aug/Sep 2015 Test su fascio all SPS del CERN Elettroni, muoni e adroni fino a 350 GeV Upgrade: rivestimento cristalli ottimizzato (vikuiti) e implementazione PD di piccola superficie (basso guadagno) 12/11/2015
Feb2013 Single crystal signal Signal of the first crystal along the beam direction hig gain | low gain All events Not-interacting 4He Test 2013 Pb+Be 30 GeV/u 4He Hit 5 RN cut 2H log(ADC counts) 12/11/2015
Feb2013 Ionization signal vs Z2 Non-linear behaviour for higher Z not instrumental but physical effect Ionization signal Cross-talk signal Equilized ADC counts Equilized ADC counts | Cl Ne | F | Na | Ne | | O | F | Na O | Non-linearity in scintillator response to high-Z ions Linear fit from He to O Linear fit from Na to Cl Courtesy of Pisa/Siena group 12/11/2015
Feb2013 Ionization signal vs Z2 Discrepancy between beam-test and MC data Not-interacting ions 30.0GeV/u (2013 test) ? ?2 Prototype calibrated with He MC tuning: 14% optical cross talk to match cube/layer signal ratio for C 4.5% additional gaussian spread to single-crystal signal to match ionization-signal spread 17% discrepancy Central crystal (gaussian fit) Total over layer MC normalized to MIP 12/11/2015
Feb2013 Showers: beam-test vs MC data +1% -5% Beam test MC +5% -3% 12/11/2015
Feb2013 Showers: energy resolution vs A ?? ? 1 ?? ? Beam test 2013 MC ?? ? ?= ? ? ??? ???? ~ 30 GeV/n 12.8 GeV/n Showers starting on layer 3 12/11/2015
Feb2013 Beam-test vs MC data Beam-test MC 30.0 GeV/n +4% -10% 12.8 GeV/n Beam test MC +6% -14% 12/11/2015
Feb2013 Energy resolution vs A ?? ? 1 ?? ? Beam test 2013 MC ?? ? ?= ? ? ??? ???? ~ 30 GeV/n 12.8 GeV/n Showers starting on layer 1 12/11/2015
Feb2013 conclusions First prototype exposed to ions of total energy ranging between 20 2000 GeV (D Fe) Study of detector response to ionization energy deposits Non-linear Z2 dependency found Study of shower classification and energy resolution MC tuned on 2013 data agreement MC/data within 15% Difficulty in MC tuning due to optical cross-talk 12/11/2015
The Feb-2015 setup Teflon wrapping + black Tedlar film Assembly CsI(Tl) cubes 3.6 cm side diffusive (Teflon tape) wrapping + absorber layer (Tedlar film) to shield optical cross-talk 3 3 14 elements (0.4 cm gap) 1.5 RM containment active depth 27 X0 1.3 I Spare 3 3 layer with test crystals Sensors VTH2090H PDs Active area 84.6 mm2 0.3 A/W @550 nm FE electronics CASIS 12/11/2015
The Feb-2015 setup BEAM TRACKER (BT) 4 Si-pixel matrixes + 8 Si-strip layers CALORIMETER 3 3 14 CsI:Tl crystals SPARE PLATE 3 3 test crystals FRONT exposure ION BEAM BACK exposure ION BEAM 12/11/2015
Feb2015 Single crystal signal Signal of the first crystal along the beam direction hig gain | low gain Test 2015 Ar+Polyethylene 30GeV/u All events Not-interacting 4He 4He Hit 5 RN cut 2H log(ADC counts) 12/11/2015
Feb2015 Calibration Scan of 3 3 column with ion beam FRONT + BACK exposure Iterative selection of not-interacting He (standalone calorimeter) Events with interacting ions accepted up to 1-layer before interaction point First iteration topological selection (cube-to-layer fraction > 90%) Second iteration + charge selection (signal MP 1.5 SIG) 12/11/2015
0 1 2 3 4 5 6 7 8 9 10 11 12 13 14 Front exposure Candidate He event Accepted up to layer 11 12/11/2015
0 1 2 3 4 5 6 7 8 9 10 11 12 13 14 Front exposure Candidate He event Accepted up to layer 5 12/11/2015
0 1 2 3 4 5 6 7 8 9 10 11 12 13 14 Back exposure Candidate He event Accepted up to layer 8 12/11/2015
Feb2015 Calibration parameters 19 GeV/u front 30 GeV/u front 30 GeV/u back ~ 1050 ~ 974 ~ 1069 12/11/2015
Feb2015 Parameter comparison 19 GeV/u front Weighted ratios: 1.019 1.004 1.028 30 GeV/u front 30 GeV/u back 12/11/2015
Feb2015 Statistical errors 19 GeV/u front 30 GeV/u front 30 GeV/u back 12/11/2015
Gain dispersion RMS 21% Merging of front&back data-set @30 GeV/u Crystal responses equalized by normalizing to 4MIP the ionization energy deposit of 4He (@peak) 2015 ?/?1??? ~ 8 Lower signal and larger dispersion due to absorber wrapping (preliminary) ADC counts (Spare plane with test crystals) CsI(Tl) with diffusive+reflective wrapping (Teflon+Vikuiti) Feb2013 1510 Feb 2015 1050 12/11/2015
2013 vs 2015 prototype beam-test 2013 beam-test 2015 33.8% 33.5% preliminary Showers starting on layer 2 He @ 30.0 GeV/n (Z-tagging from first calorimeter layer ) 32 Elena Vannuccini - Gamma400 workshop - Barcelona 29-30/06/2015
Test of scintillating materials Test of 9 scintillating materials CsI:Na, CsI:Tl, YAG:Ce, BaF2, YAP:Ce, LuAG:Ce, BSO, BGO, LYSO:Ce Teflon+Vikuiti+Tedlar wrapping Z-tagging from BT+CAL Study of the ionization signal vs Z2 ION BEAM CALORIMETER 3 3 14 CsI:Tl crystals BEAM TRACKER (BT) 4 Si-pixel matrixes + 8 Si-strip layers SPARE PLANE 3 3 test crystals 12/11/2015
Cristalleria L.Y.*VTH2090 ... * RM/16.1 Cherenkov Sp.Res. / W.L.max RM(cm) l/X0 X0(cm) Cube side (cm) @ 2t D.time (ns) l (cm) Density (g/cm3) Total n.int.lengths @ 2t Total n.rad.lengths @ 2t W.L. max. emission (nm) L.Y. (%) @300K 25,3 CaF2:Eu 3,18 34 3,1 11 3,7 86 2,5 28 435 940 50 Scionix 18,4 1,6 CsI 4,5 40 1,9 21 3,6 76 1,9 41 310 10 5 DETEC ? 1,6 43,0 CsI:Na 4,5 40 1,9 21 3,6 76 1,9 41 420 630 88 DETEC ? 43,0 100 CsI:Tl 4,5 40 1,9 21 3,6 76 1,9 41 550 1250 165 DETEC 99,8 24,2 YAG:Ce 4,57 25 3,5 7 2,8 76 3,0 22 550 70 40 Crytur ? 19,5 10,5 BaF2 4,89 31 2,0 15 3,1 74 2,4 37 300 630 36 Scionix 9,9 19,9 YAP:Ce 5,5 22 2,7 8 2,4 71 3,3 26 370 27 47 Scionix 16,3 11,9 LuAG:Ce 6,73 21 1,5 14 2,2 67 3,3 46 535 70 20 Crytur 11,0 3,3 BSO 6,8 22 1,1 20 2,2 67 3,0 60 480 100 6 MolTech 3,0 11,6 BGO 7,13 23 1,1 20 2,2 65 2,9 58 480 300 21 CERN 11,4 39,7 LYSO:Ce 7,4 21 1,1 19 2,1 65 3,1 59 402 40 85 Cinesi 37,8 0,1 PWO 8,3 21 0,9 23 2,0 62 3,0 70 425 5 0,3 MolTech 0,1 12/11/2015
Segnali attesi Z 2 3 4 5 6 7 8 1 CaF2:Eu CsI CsI:Na CsI:Tl YAG:Ce BaF2 YAP:Ce LuAG:Ce BSO BGO LYSO:Ce PWO 18 74 166 295 461 664 904 1181 2 6 14 25 39 56 77 100 X X X X X X X X X 43 172 387 687 1074 1546 2105 2749 100 399 898 1596 2494 3592 4889 6386 19 78 175 312 487 701 954 1246 10 40 89 159 248 357 486 634 16 65 146 260 407 586 798 1042 11 44 99 175 274 394 537 701 3 12 27 49 76 110 149 195 11 46 103 183 286 411 560 731 38 151 340 604 944 1360 1851 2417 0 0 1 1 2 3 4 5 Segnale di ionizzazione atteso (% del CsI:Tl), tenendo conto della risposta spettrale del PD, della LY, delle dimensioni e della densit del cristallo, in funzione dello ione. CsI(Tl) S/N>10 @mip (CERN 2013) Evidenziati gli ioni dai quali ci si aspetta un segnale rivelabile (S/N>5) 12/11/2015
Signals CsI:Na CsI:Tl YAG:Ce BaF2 LuAG:Ce YAP:Ce BGO LYSO All events Non-interacting He 12/11/2015
Crystals YAP Expected Measured Norm. @CsI:Tl (a.u.) Z=1 (a.u.) Z=2 (a.u.) Z=2 (ADC counts)Relative width Measured /Expected CsI:Na 43 172 1336 8,3% 229 1,3 CsI:Tl 100 399 2330 7,6% 399 1,0 YAG:Ce 19 78 642 95 9,4% 14,6% 110 16 1,4 0,4 LuAG BaF2 10 40 YAP:Ce 16 65 316 13,7% 54 0,8 LuAG:Ce 11 44 674 9,1% 115 2,6 - - - - BSO 3 12 BGO 11 46 312 13,4% 53 1,2 LYSO:Ce 38 151 759 7,6% 130 0,9 (preliminary) 12/11/2015
Next steps Implementation of BT information, under progress Shower analysis: Comparison of energy resolution for individual ions with Feb2013 results Tuning of MC model (no OCT) and comparison with beam-test data Test crystals: Study of ionization signal with Z-tag given by BT 12/11/2015


