Analysis of Vietnamese Banking System Efficiency
This presentation explores the efficiency of the Vietnamese banking system by analyzing milestones, literature reviews, methodology, and results. It discusses objectives, development history, number of commercial banks, and recent research on bank efficiency in Vietnam.

Download Presentation

Please find below an Image/Link to download the presentation.
The content on the website is provided AS IS for your information and personal use only. It may not be sold, licensed, or shared on other websites without obtaining consent from the author.If you encounter any issues during the download, it is possible that the publisher has removed the file from their server.
You are allowed to download the files provided on this website for personal or commercial use, subject to the condition that they are used lawfully. All files are the property of their respective owners.
The content on the website is provided AS IS for your information and personal use only. It may not be sold, licensed, or shared on other websites without obtaining consent from the author.
E N D
Presentation Transcript
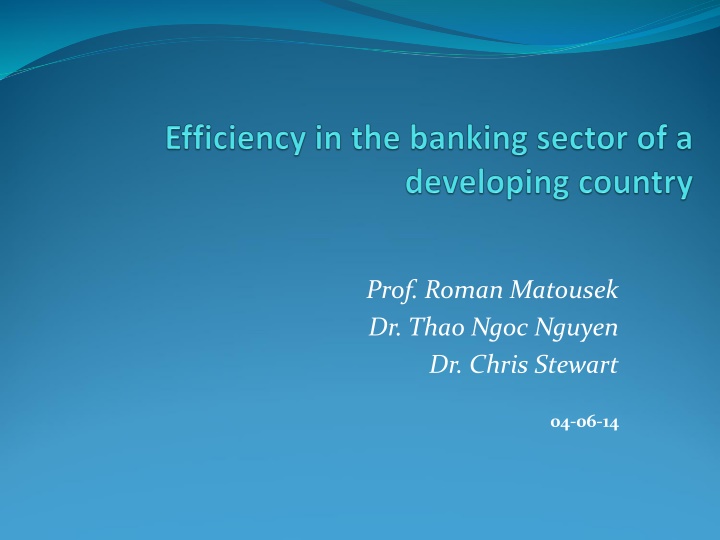
Prof. Roman Matousek Dr. Thao Ngoc Nguyen Dr. Chris Stewart 04-06-14
Outline of the presentation Objectives Vietnamese banking system Literature review Methodology Results Conclusions 1. 2. 3. 4. 5. 6.
1. Objectives The first objective of this paper is to analyse for the first time the level of efficiency of the Vietnamese banking system as whole. In addition, we advance current research by applying the more robust innovative method, introduced by Simarand Wilson (2007) semi-parametric two stage Explanatory variables (being asset size, the proportion of non-performing loans, branch networks, the number of years since establishment and city banks) are included in the second stage forestimation. Furthermore, efficiency scores are also calculated for sub- samples based upon asset size (small, medium, large and very large banks) and bank type (state owned commercial banks, joint stock commercial banks and joint venture commercial banks).
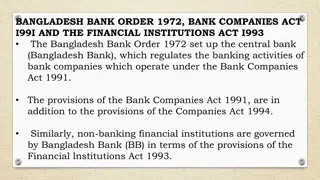
2. Milestones of the development of the banking system of Vietnam 1997 Laws on the SBV and FIs were issued 2007 Financial crisis hit the banking system 02/1951 SBV was found 01/2007 Vietnam jointed WTO 1997 Asian financial crisis 1950 1985 1990 1995 2000 2005 2002 Passage of banking reform plan 1986 reforms 09/2008 HSBC, SCB opened wholly owned units 1991 First JSCBs were established
The number of commercial banks from 1990 to 2009 1990 1995 2000 2005 2009 State Owned Commercial Banks 4 4 5 5 5 Joint Stock Commercial Banks 0 36 39 37 37 Branches of Foreign Banks 0 18 26 31 44 Joint Venture Commercial Banks 0 4 5 5 5 Total 4 62 75 78 91
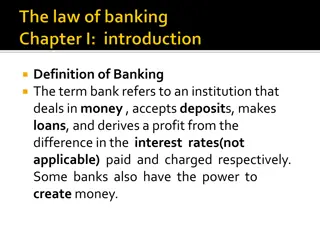
3. Literature reviews The recent empirical research on bank efficiency in Vietnam used a small unrepresentative number of banks and covered only a short period of time in the system. The research of Nguyen (2007) measured efficiency by employing DEA. His research has been applied to a sample of only 13 banks in Vietnam over the period of 2001-2003. Nguyen and De Borger (2008) considered single bootstrap efficiency and the Malmquist Index for 15 banks for the period of 2003-2006.
4. Methodology Current empirical research on bank efficiency applies two methodologies: the non-parametric Data Envelopment Analysis (DEA), and the parametric Stochastic Frontier Approach (SFA). s s = m = m U Y U Y , r r j , 0 r r DEA: max subject to = i 1 1 r = 1 r 0 = i V X V X , i i j , 0 i i 1 1 U, V>=0; r=1,2,...s; i=1,2,...m; j=1,2,...n. Consider the jth bank with outputs and inputs Yrj, Xij (that are all positive) where Ur and Vi are the variable weights (Charnes et al., 1978: 430).
DEA v.s. DEA double bootstrap method of Simar and Wilson (2007) The true efficiency score is not observed directly, rather it is empirically estimated. The empirical estimates of the efficiency frontier are obtained based on the chosen sample of banks, thereby ruling out some efficiency production possibilities not observed in the sample (Simar and Wilson, 2007). The DEA two-stage procedure also depends upon other explanatory variables, which are not taken into account in the first-stage efficiency estimation. The domain of the efficient score is restricted to the zero-one interval, which should be taken into account in the second-stage estimation stage.
DEA double bootstrap method of Simar and Wilson (2007) In the first stage, we use DEA to estimate the relative efficiency scores in the sample using, alternatively, constant returns to scale (Charnes et al., 1978) and variable returns to scale (Banker et al., 1984). Inputs are: staff, purchased funds; and customer deposits Outputs include: customer loans; other loans; and securities In the second stage, we apply the Simar and Wilson (2007) procedure to bootstrap the DEA scores with a truncated bootstrapped regression. Data : 48 Vietnamese banks from 1999 to 2009
DEA double bootstrap method of Simar and Wilson (2007) = + + + + + + + + TA ( ) ( ) ( ) ( ) ROA COA CITY LN LN NLCL LN BR LN AGE t i , 0 1 t i , 2 , 3 t i , 4 t i , 5 t i , 6 t i , 7 , t i , t i t i ROA: profit before tax divided by total assets COA: total costs divided by total assets CITY: is equal to one if a bank is transformed from a rural commercial bank to a city commercial bank and zero otherwise. LN(TA) is the natural logarithm of total assets LN(NLCL) is the natural logarithm of the ratio of non-performing loans to customer loans. LN(BR) is the natural logarithm of total branches LN(AGE) is the natural logarithm of the number of years the bank existed before 2009.
5. Results CCR: Constant returns to scale; BCC: Variable return to scale CCR 1999 2000 2001 2002 2003 2004 2005 2006 2007 2008 2009 MEAN initialBootstrap 0.58 0.66 0.67 0.66 0.68 0.75 0.78 0.8 0.87 0.86 0.87 0.74 BCC 1999 2000 2001 2002 2003 2004 2005 2006 2007 2008 2009 MEAN initialBootstrap 0.65 0.68 0.72 0.72 0.75 0.84 0.87 0.89 0.93 0.92 0.95 0.81 0.54 0.56 0.59 0.59 0.6 0.68 0.72 0.76 0.83 0.8 0.82 0.68 0.58 0.6 0.64 0.67 0.68 0.77 0.78 0.83 0.89 0.88 0.9 0.75
GDP, inflation rate, DEA-CCR and DEA-BCC average scores (1999-2009)
Efficiency scores as the double bootstrap method in terms of bank type Year State owned banks Joint stock banks CCR BCC 0.52 0.64 0.51 0.63 0.59 0.73 0.63 0.84 0.66 0.83 0.68 0.89 0.74 0.94 0.84 0.99 0.87 0.98 0.86 0.83 0.7 0.86 Joint venture banks CCR 0.54 0.69 0.69 0.71 0.72 0.68 0.82 0.77 0.75 0.89 0.92 0.74 CCR BCC BCC 1999 2000 2001 2002 2003 2004 2005 2006 2007 2008 2009 MEAN 0.54 0.56 0.57 0.55 0.57 0.68 0.71 0.75 0.83 0.78 0.8 0.67 0.56 0.58 0.59 0.61 0.62 0.75 0.75 0.8 0.9 0.86 0.88 0.72 0.55 0.7 0.71 0.74 0.79 0.72 0.85 0.84 0.78 0.9 0.92 0.77 1 1
Efficiency scores as the double bootstrap method in terms of asset size in 2009 Year small banks CCR 0.51 0.49 0.56 0.55 0.55 0.66 0.72 0.73 0.81 0.81 0.83 0.65 medium banks large banks CCR BCC 0.46 0.47 0.49 0.5 0.46 0.47 0.5 0.54 0.6 0.65 0.68 0.81 0.72 0.8 0.83 0.87 0.84 0.93 0.77 0.88 0.75 0.85 0.65 0.71 very large banks CCR 0.49 0.58 0.68 0.73 0.7 0.69 0.73 0.77 0.83 0.81 0.85 0.71 BCC CCR BCC BCC 0.52 0.5 0.57 0.59 0.64 0.74 0.74 0.77 0.85 0.87 0.89 0.7 0.71 0.76 0.68 0.62 0.59 0.7 0.73 0.75 0.86 0.8 0.87 0.73 0.71 0.78 0.71 0.67 0.62 0.74 0.78 0.83 0.94 0.9 0.95 0.78 0.63 0.69 0.82 0.93 0.86 0.85 0.89 0.94 0.94 0.94 0.99 0.86 1999 2000 2001 2002 2003 2004 2005 2006 2007 2008 2009 MEAN
Determinants of CCR and BCC efficiency for the Vietnamese banking system Overall technical efficiency (CCR) Pure technical efficiency (BCC) -0.824*** (-4.418) 1.712** C -0.403* (-2.254) 1.669** (2.082) -0.467 (-1.794) 0.156*** (4.271) 0.079*** (6.467) -0.012 (-0.996) -0.065*** (-4.277) -0.096*** (-3.454) ROA (2.05) -0.348 (-1.283) 0.506 (1.159) 0.164 (1.129) -0.012 (-0.928) -0.064*** (-4.012) -0.083*** (-2.877) COA CITY LNTA LNNLCL LNBR LNAGE Obs 379 379 Note: The variables coefficients and t-statistics (in brackets) are reported in the table; *** 1% level, ** 5% level * 10% level. Sources: Financial statements of 48 Vietnamese banks in the period of 1999-2009.
6. Conclusions We find that while bank efficiency generally rose over the period it did not increase every year, for example, between 2001 and 2002 as well as 2007 and 2008. The results indicate that large and very large banks are more efficient than small and medium sized banks. Moreover, banks with large branch networks and those that have been in existence for a long time are less efficient than other banks. Our results also indicate that non-state owned commercial banks exhibit greater overall technical efficiency (based on the CCR measure) than state owned commercial banks.
Thank you for your attention!


")
")