Analyze School Behavior Data for Effective Intervention
Gain valuable insights into behavior data such as ODRs, suspensions, and more to effectively manage student behavior in the given school. Dive into detailed reports on various metrics including ODRs by month, daily averages, suspensions, days out of school, and more to identify trends and patterns that inform targeted interventions.

Uploaded on | 2 Views
Download Presentation

Please find below an Image/Link to download the presentation.
The content on the website is provided AS IS for your information and personal use only. It may not be sold, licensed, or shared on other websites without obtaining consent from the author. If you encounter any issues during the download, it is possible that the publisher has removed the file from their server.
You are allowed to download the files provided on this website for personal or commercial use, subject to the condition that they are used lawfully. All files are the property of their respective owners.
The content on the website is provided AS IS for your information and personal use only. It may not be sold, licensed, or shared on other websites without obtaining consent from the author.
E N D
Presentation Transcript
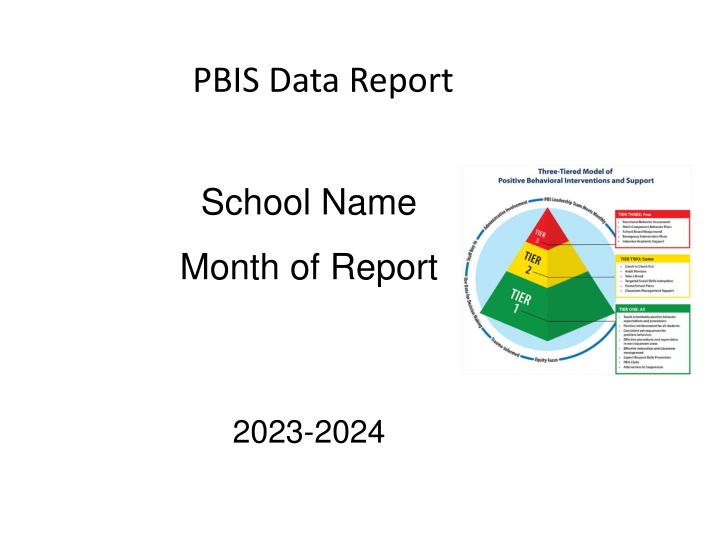
PBIS Data Report School Name Month of Report 2023-2024
Analyze Behavior Data by: 1. ODRs by Month YTD 2. ODRs by Month Daily Average YTD 3. Suspensions by Month YTD 4. Suspension Days Out of School YTD 5. Suspensions by Month Year to Year 6. ODRs by Infractions YTD 7. ODRs by Location YTD 8. ODRs by Time YTD 9. ODRs by Student Levels (use for Tier 2/3) 10. ODRs by Grade Level YTD 11. ODRs by Gender YTD 12. ODRs by Faculty YTD 13. ODRs by Ethnicity 14. Suspensions by Ethnicity 15. Risk Ratios by Ethnicity 16. Suspensions of Student with Disabilities 17. Penalties by Month (Suspension Alternatives) 18. Positive Behavior Indicator (not in MiStar the school selects a positive to track)
ODRs by Student Levels (Use ID numbers)
Risk Ratios by Ethnicity YTD Review Quarterly
Suspensions of Students with Disabilities YTD
If disproportionality by ethnicity is a concern in your school, complete the following two slides. What is the targeted sub-group of concern ? ____________________________ What changes to our Tier 1 program need to be made to make it more culturally responsive? _______________________________________________________ How many of the targeted sub-group students receive Tier 2 support? _________________________________________________________________ Specify how many are on each Tier 2 Intervention: CICO: Adult Mentor: Take a Break: Home/School Plan: Targeted Social Skills: High Interest Club: Academic Support: Homework Help: Other:
Providing Tiered Supports to Students with Multiple Referrals How many students from the targeted sub-group receive Tier 3 support?____________________________________ Specify how many are on each Intervention PBIS plan with FBA: On-going counseling: Small Group Work: School-based Wrap-around: Alternatives to Suspension: Mental Health Services: Court Involvement: Other:
Penalties by Month (Suspension Alternatives)
Positive Behavior Indicators Your Choice
Tier 2 Summary How many students are currently on Tier 2 plans? What number/percentage of those students are showing improvement? Include students individual Check In/Check Out Data Summaries with this report.
Data Analysis Complete new analysis each month describe briefly. How are we doing overall? What positives have been occurring and what are areas of concern? ____________________________ What are the hot spots? Identify most frequent: Problem behaviors: Students/Groups: Grades: Attendance concerns:______________________________ Location: ____________________________________________ Other:
Data Analysis (cont.) Describe target interventions to be implemented (based upon the PBIS Team s review of the data) Action plan: describe what will be done to implement and evaluate target interventions
Data Analysis (cont.)2 PBIS Team met on what date(s) last month? PBIS Team will share data with staff when & how?


")
2")