Analyzing and Reporting Ithaka S+R Survey Results Using Google Data Studio
Dive into the pros and cons of analyzing and reporting Ithaka S+R survey data using Google Data Studio. Learn about the challenges of handling large quantities of data and the comparison with Tableau. Explore the capabilities of Google Data Studio in creating tailored data views for stakeholders, data visualization, and additional analysis options. Prioritize stakeholder engagement, data protection, and utilizing available tools to enhance your reporting process.
Download Presentation

Please find below an Image/Link to download the presentation.
The content on the website is provided AS IS for your information and personal use only. It may not be sold, licensed, or shared on other websites without obtaining consent from the author.If you encounter any issues during the download, it is possible that the publisher has removed the file from their server.
You are allowed to download the files provided on this website for personal or commercial use, subject to the condition that they are used lawfully. All files are the property of their respective owners.
The content on the website is provided AS IS for your information and personal use only. It may not be sold, licensed, or shared on other websites without obtaining consent from the author.
E N D
Presentation Transcript
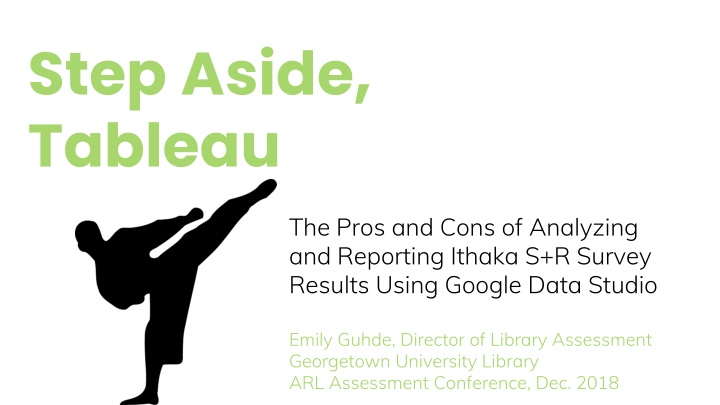
Step Aside, Tableau The Pros and Cons of Analyzing and Reporting Ithaka S+R Survey Results Using Google Data Studio Emily Guhde, Director of Library Assessment Georgetown University Library ARL Assessment Conference, Dec. 2018
The Challenge with Ithaka S+R Survey Data Great quantity of data Multi-layered data Data about all aspects of library service In short, it s a lot of work, and tools can help get your data into good shape.
Tableau Highly ranked for analytics and business intelligence 3
TBH, I dont Tableau The Price The Price The Look The Look Many products, some free, some not Feels a bit like a blog post Public (free) Don t know where to start or end Desktop (the software) Just the data, no analysis or interpretation Creator (monthly fee) Viewer (monthly fee) Reader (free)
But what else is there? Google Data Studio
Its like if PowerPoint and Excel and InDesign had a baby. -distinguished colleague
Priorities Engage with stakeholders Show data viz + analysis Avoid linear only view Use available tools Protect data
Google Data Studio: The Pros
Filters Data views tailored to specific stakeholders
Data Viz The basics and growing
Appendices Additional analysis and interpretation
Navigation Start to finish or choose your own adventure
Built-in Free and easily integrated on a Google campus
Secure Sharing Just like sharing a Google Doc
Google Data Studio: The Cons
Breakage Better since out of Beta version Fonts & Format Options are growing, but the lack of flexibility can be painful Speed Many windows make slow going (sometimes) Delegation Editors can edit, but they can t modify the data source
Thanks! Any questions? Any questions? You can find me at: eg716@georgetown.edu
