Analyzing Atmosphere Components During Solar Noon
The study conducted by Bayleigh Jettton & Elizabeth Hernandez from Alpena Elementary/Middle School investigates how aerosols, surface temperature, and cloud cover change during the two-hour solar noon window for GLOBE data collection. Using GLOBE protocols, the researchers followed specific procedures over a 15-day period to make observations and collect data, aiming to understand these atmospheric variations. Through their hypothesis, data collection methods, and analysis, the researchers delve into the dynamics of the atmosphere during this crucial time frame.
Uploaded on Feb 26, 2025 | 0 Views
Download Presentation

Please find below an Image/Link to download the presentation.
The content on the website is provided AS IS for your information and personal use only. It may not be sold, licensed, or shared on other websites without obtaining consent from the author.If you encounter any issues during the download, it is possible that the publisher has removed the file from their server.
You are allowed to download the files provided on this website for personal or commercial use, subject to the condition that they are used lawfully. All files are the property of their respective owners.
The content on the website is provided AS IS for your information and personal use only. It may not be sold, licensed, or shared on other websites without obtaining consent from the author.
E N D
Presentation Transcript
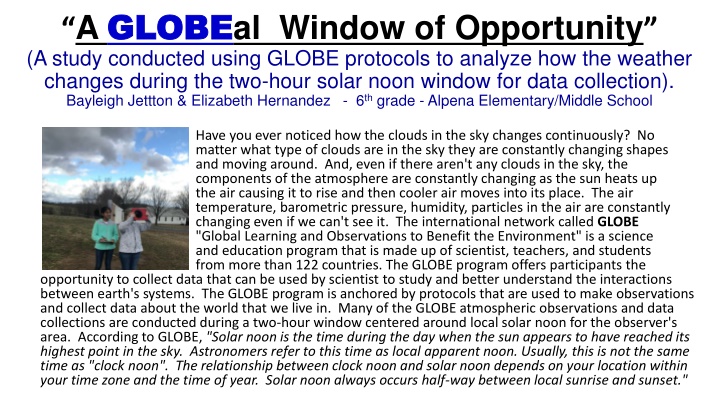
A GLOBE GLOBEal Window of Opportunity (A study conducted using GLOBE protocols to analyze how the weather changes during the two-hour solar noon window for data collection). Bayleigh Jettton & Elizabeth Hernandez - 6thgrade - Alpena Elementary/Middle School Have you ever noticed how the clouds in the sky changes continuously? No matter what type of clouds are in the sky they are constantly changing shapes and moving around. And, even if there aren't any clouds in the sky, the components of the atmosphere are constantly changing as the sun heats up the air causing it to rise and then cooler air moves into its place. The air temperature, barometric pressure, humidity, particles in the air are constantly changing even if we can't see it. The international network called GLOBE "Global Learning and Observations to Benefit the Environment" is a science and education program that is made up of scientist, teachers, and students from more than 122 countries. The GLOBE program offers participants the opportunity to collect data that can be used by scientist to study and better understand the interactions between earth's systems. The GLOBE program is anchored by protocols that are used to make observations and collect data about the world that we live in. Many of the GLOBE atmospheric observations and data collections are conducted during a two-hour window centered around local solar noon for the observer's area. According to GLOBE, "Solar noon is the time during the day when the sun appears to have reached its highest point in the sky. Astronomers refer to this time as local apparent noon. Usually, this is not the same time as "clock noon". The relationship between clock noon and solar noon depends on your location within your time zone and the time of year. Solar noon always occurs half-way between local sunrise and sunset."
RESEARCH QUESTION RESEARCH QUESTION The GLOBE atmospheric observations and data collections for Aerosols, Surface Temperature, and Cloud Cover, are centered around the two-hour window around local solar noon. The research question being addressed in this investigation is, "How do the components of the atmosphere, Aerosols, Surface Temperature, and Cloud Cover change during the two-hour solar noon window for GLOBE observations and data collection?" HYPOTHESIS HYPOTHESIS Based on the researcher's previous experience in making solar noon observations for GLOBE, it was predicted that the air and surface temperatures would increase and the barometric pressure, relative humidity, and cloud cover would decrease as the window progresses from the beginning of the solar noon window to the close. It was predicted that there would be a significant difference in the AOT readings from the beginning to the end of the solar non window. It was also predicted that 40% of the days, (2 out of every 5), would show a significant difference in cloud cover. Bayleigh Jettton & Elizabeth Hernandez
PROCEDURE PROCEDURE For the past year, the researchers have been making observations and collecting data using the GLOBE protocols for Aerosols, Surface Temperature, and Cloud Cover. Over a period of 15 days, the observers followed the GLOBE protocols for making observations and collecting data for Aerosols, Surface Temperature, and Cloud Cover. The first set of observations and data collections were conducted during the beginning of the solar noon window that occurred during the noon recess right after lunch. The researchers collected the solar noon and ending of solar noon window data during their science classes over the next two hours. A Calitoo meter was used to collect Aerosol Optical Thickness (AOT). AOT data was only available on the days when clouds were not blocking the sun. GLOBE Cloud charts were used to analyze the types of clouds and cloud cover. A digital infrared thermometer was used to collect the surface temperature. An iPad was used to record the cloud observations. All data collected was recorded on GLOBE data sheets and then entered into the GLOBE website data base according to the GLOBE protocols for each type of observation. Bayleigh Jettton & Elizabeth Hernandez
AEROSOL RESULTS AEROSOL RESULTS Aerosol data was collected on 8 different dayswhen the sun was not covered by clouds. The Calitoo meter measures AOT in three wavelengths, Blue-465 nanometers, Green-540 nanometers, and Red-619 nanometers. The beginning of solar noon:averaged blue=0.080, Green=0.064, and red=0.077, for an overall average of 0.073. The solar noon:averaged blue=0.123, Green=0.113, and red=0.110, for an overall average of 0.115. The end of solar noon:averaged blue=0.068, Green=0.053, and red=0.066, for an overall average of 0.073. SURFACE TEMPERATURE RESULTS SURFACE TEMPERATURE RESULTS Surface Temperature results were collected on all 15 days. According to the GLOBE protocols, 9 temperatures were recorded for each observation for a total of 405 total surface temperatures recorded and analyzed. The average surface temperature at the beginning of the solar noon window was 18.5 C. The average surface temperature at solar noon was 18.7 C. The average surface temperature at the ending of the solar noon window was 20.3 C. Bayleigh Jettton & Elizabeth Hernandez
CLOUD OBSERVATION RESULTS CLOUD OBSERVATION RESULTS The average cloud coverat the beginning = 45.3%, at solar noon = 45.3%, at the ending of the window = 43.3%, resulting in a 2% decrease in the last hour. The average air temperatureat the beginning = 14.6 C, at solar noon = 15.5 C, at the ending of the window = 16.4 C. The air temperature increased by 0.9 C each hour resulting in a 6% per hour increase in temperature. The average relative humidityat the beginning = 14.6 C, at solar noon = 15.5 C, at the ending of the window = 16.4 C. Relative humidity decreased 3.8% the first hour and decreased by 1.4% the last hour of the solar noon window. The average barometric pressureat the beginning = 974.3mb, at solar noon = 973.5mb, at the ending of the window = 972.9mb. Barometric pressure decreased by 0.8mb the first hour and then only by 0.6mb the last hour. Bayleigh Jettton & Elizabeth Hernandez
CONCLUSION CONCLUSION The hypothesis was mostly supported by the data. As predicted, the air and surface temperatures increased and the barometric pressure, and relative humidity decreased as the window progresses from the beginning of the solar noon window to the close. However, the cloud over did not change very much during the solar noon window. Sometimes it increased slightly and sometimes it decreased slightly resulting in only a 2% change in cloud cover. The most significant differences recorded during the solar noon window were the readings for AOT. The solar noon AOT readings were 58% higher than the beginning of the window and 85% higher than the readings recorded at the end of the solar noon window. After reviewing all of the data, the researchers have concluded that the overall weather conditions change only slightly during the solar noon window of opportunity for data collection. The researchers recommend that when collecting the solar noon weather data, it would be best to always try and collect it during the same part of the solar noon window in order to make the observations more consistent. Bayleigh Jettton & Elizabeth Hernandez
Bayleigh Jettton & Elizabeth Hernandez Barometric Pressure Data Collection Results (recorded as average mb during Cloud Observations) Air Temperature Data Collection Results (recorded as average C during Cloud Observations) Aerosol Data Collection Results (Recorded in three different wavelength with a CALITOO meter as AOT (Aerosol Optical Thickness) Beginning of the Solar Noon Window End of the Solar Noon Window Beginning of the Solar Noon Window End of the Solar Noon Window Solar Noon Solar Noon Test Date Test Date Beginning of the Solar Noon Window End of the Solar Noon Window Solar Noon 969 969 968 23.5 22.9 23.1 10/15 10/15 Channel Wavelength Channel Wavelength Channel Wavelength Test Date Blue 465 Green 540 Red 619 Blue 465 Green 540 Red 619 Blue 465 Green 540 Red 619 977 977 977 12.5 13.8 15.0 10/16 10/16 976 973 974 10/17 18.8 19.4 22.2 10/17 10/16 0.091 0.071 0.081 0.084 0.065 0.077 0.084 0.064 0.074 970 969 968 10/18 21.8 23.1 23.6 10/18 10/17 0.075 0.059 0.075 0.078 0.061 0.075 0.080 0.062 0.077 966 965 964 10/19 17.8 19.7 21.9 10/19 10/18 0.088 0.072 0.088 0.151 0.136 0.155 0.060 0.045 0.058 964 964 964 10/21 16.3 17.3 19.3 10/21 975 974 972 10/22 16.4 17.6 18.2 10/21 0.072 0.060 0.077 0.208 0.169 0.174 0.064 0.052 0.064 10/22 973 972 972 10/23 22.7 23.8 23.9 10/23 10/22 0.073 0.059 0.072 0.204 0.246 0.191 0.068 0.055 0.068 980 979 979 10/24 10.5 10.8 10.0 10/24 10/23 0.071 0.056 0.072 0.074 0.059 0.075 0.076 0.061 0.076 980 978 977 10/25 808 9.7 10.2 10/25 973 972 971 10/28 10/31 0.134 0.112 0.113 0.150 0.139 0.124 0.069 0.056 0.065 18.2 20.2 19.6 10/28 977 977 976 10/29 8.0 8.0 8.6 10/29 11/01 0.040 0.030 0.045 0.042 0.032 0.048 0.041 0.032 0.048 973 972 971 10/30 7.3 7.7 7.7 10/30 0.644 0.519 0.623 0.991 0.907 0.879 0.542 0.427 0.530 Total 981 982 980 10/31 3.6 4.8 6.1 10/31 981 980 981 11/01 Mean 0.080 0.064 0.077 0.123 0.113 0.110 0.068 0.053 0.066 12.4 14.8 15.8 11/01 14,615 14,603 14,594 Total 218.6 233.0 245.3 Total 0.115 AOT Solar Noon 0.073 AOT Beginning of the Solar Noon Window 0.062 AOT End of the Solar Noon Window Overall Mean AOT Mean Barometric Pressure 974.3mb 973.5mb 972.9mb Mean Air Temperature 14.6 C 15.5 C 16.4 C
Air Temperature Results Relative Humidity Results Air Temperature Results Relative Humidity Results Bayleigh Jettton & Elizabeth Hernandez
Bayleigh Jettton & Elizabeth Hernandez Surface Temperature Data Collection Results (recorded as average C) Cloud Coverage Data Collection Results (recorded as average % of Cloud Cover) Relative Humidity Data Collection Results (recorded as % Relative Humidity during Cloud Observations) Scale used for calculating Cloud Cover: None = 0, Few = 10%, Isolated = 20%, Scattered = 40%, Broken = 70%, Overcast = 90% Beginning of the Solar Noon Window End of the Solar Noon Window Beginning of the Solar Noon Window 95 69 59 63 95 56 43 37 95 95 95 95 95 64 37 1,093 End of the Solar Noon Window 95 57 63 54 73 50 34 52 95 95 72 95 95 56 29 1,019 Solar Noon Test Date Solar Noon Test Date Beginning of the Solar Noon Window End of the Solar Noon Window 95 64 63 59 85 51 38 30 95 95 84 95 95 58 30 21.6 21.1 26.7 10/15 10/15 Solar Noon Test Date 21.8 22.5 25.6 10/16 10/16 90 0 0 40 70 10 10 10 90 90 70 90 90 20 0 680 90 0 0 40 90 0 10 10 90 90 70 90 90 10 0 680 70 10 10 20 70 0 10 10 90 90 70 90 90 20 0 650 27.5 27.6 26.0 10/15 10/17 10/17 10/16 26.9 30.6 35.7 10/18 10/18 10/17 18.7 20.6 25.9 10/19 10/19 10/18 24.6 23.6 23.5 10/21 10/21 10/19 23.0 22.6 23.4 10/22 10/22 10/21 25.3 27.7 24.3 10/23 10/23 10/22 12.6 10.6 3.6 10/24 10/24 10/23 9.3 8.6 9.1 10/25 10/25 10/24 20.3 19.6 29.8 10/28 10/28 10/25 8.6 9.6 9.6 10/29 10/29 10/28 10.2 7.1 10.1 10/30 10/29 10/30 9.3 10.2 10.5 10/31 10/30 10/31 18.2 18.8 20.3 11/01 10/31 11/01 277.9 280.8 304.1 Total 11/01 1,037 Total Total Mean Surface Temperature Mean Relative Humidity 18.5 C 18.7 C 20.3 C 72.9% 69.1% 67.7% Mean Cloud Cover 45.3% 45.3% 43.3%
