Analyzing Components of ROCE and RNOA for Value Creation
Learn how a firm increases its value through growing sales, earning high income per sale dollar, and managing net assets efficiently. Explore the factors affecting ROCE, including operating efficiency and financial leverage, along with the drivers of RNOA such as operating profit margin and asset turnover. Understand the impact of leverage on ROCE and delve into the components of PM, ATO, and OLLEV for insightful analysis.
Download Presentation

Please find below an Image/Link to download the presentation.
The content on the website is provided AS IS for your information and personal use only. It may not be sold, licensed, or shared on other websites without obtaining consent from the author. If you encounter any issues during the download, it is possible that the publisher has removed the file from their server.
You are allowed to download the files provided on this website for personal or commercial use, subject to the condition that they are used lawfully. All files are the property of their respective owners.
The content on the website is provided AS IS for your information and personal use only. It may not be sold, licensed, or shared on other websites without obtaining consent from the author.
E N D
Presentation Transcript
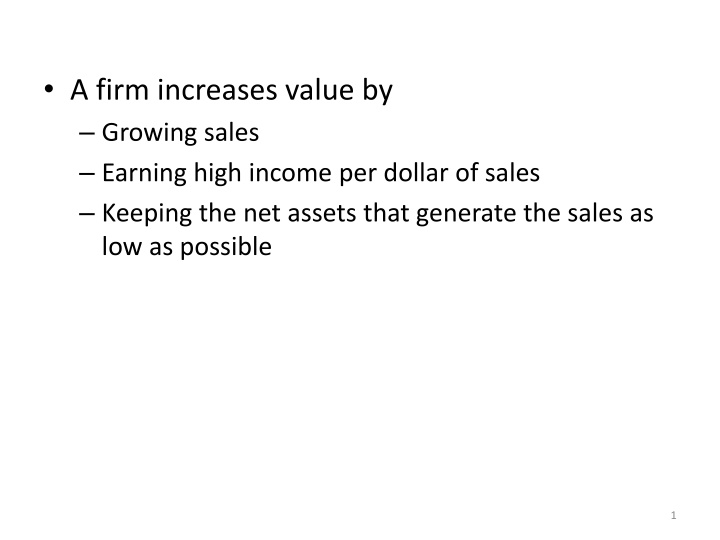
A firm increases value by Growing sales Earning high income per dollar of sales Keeping the net assets that generate the sales as low as possible 1
First level breakdown: Analyze the components of ROCE Return on common equity (ROCE) ROCE = Comprehensive income (CI)/CSE There are two factors affecting ROCE Operating efficiency Financial leverage 2
If a company has leverage (i.e., it has NFO) ROCE = RNOA + [FLEV x (RNOA NBC)] RNOA = Return on net operating assets = operating income/NOA FLEV = NFO/CSE (RNOA NBC) = spread (difference between RNOA and net borrowing cost (NBC)) 3
If a company has no leverage (i.e., it has NFA) ROCE = RNOA - [(NFA/CSE) x (RNOA RNFA)] RNOA = Return on net operating assets = operating income/NOA NFA/CSE reflects the fact that the firm is a net lender, i.e., it has financial income in addition to operating income (RNOA RNFA) = spread (difference between RNOA and the return on net financial assets, RNFA) A positive spread means operating activities are more profitable than financing activities (which is usually the case), and ROCE will be lower than RNOA RNFA = Net financial income/NFA 4
Second level breakdown: Analyze the components of RNOA The two drivers of RNOA are Operating profit margin (PM) = Operating income (after tax)/Sales Shows the profitability of each dollar of sales Asset turnover (ATO) = Sales/NOA Measures sales revenue per dollar of NOA The inverse, 1/ATO = NOA/Sales, shows the $ amount of NOA used to generate 1$ of sales. For example, if the ATO = 2, 1/ATO = 0.5, indicating that the firm uses $0.50 of NOA to generate $1.00 of sales 5
Third level breakdown: Analyze the components of PM and ATO For PM drivers, analyze the components that make up operating income For ATO drivers, analyze the components of NOA A useful ratio in analyzing ATO is operating leverage (OLLEV) OLLEV = Operating liability (OL)/NOA Operating liabilities reduce the NOA that are employed, and increases ATO 6


