Analyzing Computational Archival Science Research
This content discusses the Human Face of Big Data Project, an archival endeavor blending archival concepts with system design and agile development, positioned within the realm of Computational Archival Science themes.

Uploaded on Mar 16, 2025 | 1 Views
Download Presentation

Please find below an Image/Link to download the presentation.
The content on the website is provided AS IS for your information and personal use only. It may not be sold, licensed, or shared on other websites without obtaining consent from the author.If you encounter any issues during the download, it is possible that the publisher has removed the file from their server.
You are allowed to download the files provided on this website for personal or commercial use, subject to the condition that they are used lawfully. All files are the property of their respective owners.
The content on the website is provided AS IS for your information and personal use only. It may not be sold, licensed, or shared on other websites without obtaining consent from the author.
E N D
Presentation Transcript
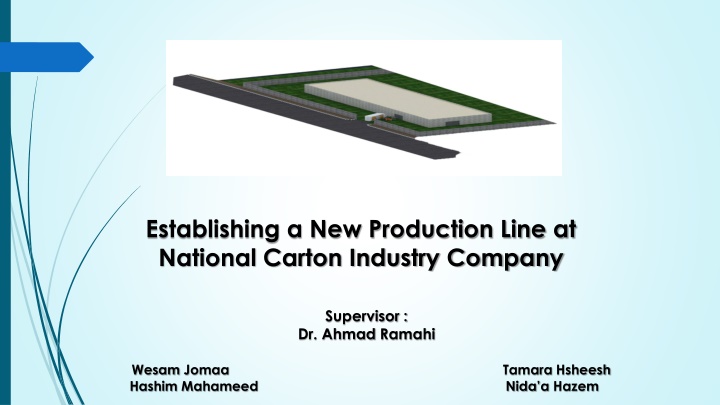
Establishing a New Production Line at National Carton Industry Company Supervisor : Dr. Ahmad Ramahi Wesam Jomaa Tamara Hsheesh Hashim Mahameed Nida a Hazem
2 introduction Production planning Plant layout Economic feasibility study Conclusion and Recommendation
Introduction 3 The national Carton Industry Company (NCI) was established in 1989. The only main branch of (NCI) is located in the east industrial area in Nablus. focuses its work in the field of manufacturing of carton boxes and in the manufacturing of packaging material including corrugated carton.
4 Carton Industry company (NCI)aims to Establish a new production line at a particular location and specific area to shaping and cutting cardboard plates, The production line is located in the industrial area of Dier-Sharaf.
Problem Statement 6 This study need to support the NCI in taking proper decisions: Production Planning Economic feasibility study Plant layout
7 Production Planning The planning of production line and manufacturing in a plant. It utilizes the resource allocation of activities, materials and production capacity, in order to serve customers. Manufacturing metrics Routing Inventory management
Data a bout production line 8 Descriptions Length (m) Width(m) Area(m ) value 75.95m 23.75m 1803.81m Row material Finished product 4 truck per day 3 truck per day Number of truck Load for truck Production speed (standard) Number of machine Shape of machine Dimensions of machine (m) 7 ton 11000 carton board per hour 1 machine (martin 1624/28)L shape (11*33.5)m
9 Manufacturing Metrics Production Rate Production Capacity Utilization Availability Manufacturing Lead Time
10 Production Rate (Rp): Rp=60/Tc Description Tc Tr Max To Rp Unit min min min cycle/hr Value 0.398 0.018 0.38 9060 Production Capacity(PCw):PCw=n*Sw*Hs*Rp/no Description n Sw Hs Rp no PCw Value 1 6 6.5 9060 1 353340 unit/wk
Utilization(U):U=Q/PCw 11 Description Value 16 ton 6 day 1430 137280 unit 353340 unit 36% Quantity of row material per day # of day in week # of cardboard sheets per ton Q PCw Utilization Availability(A): A=(MTBF-MTTR)/MTBF Description Value MTBF MTTR 4 hr 0.5 hr 87.5% Availability Manufacturing Lead Time(MLT): MLT=no*Tc Description No Tc MLT Value 5 operation 0.398 min/cycle 1.99 min/cycle
Routing 12 Routing may be defined as the selection of path which each part of the product will follow while being transformed from raw materials to finished products.
Time sheet in the production line 13 Task number Symbols Description of task Time taken Machinery required O I T S D 6.913 hr 1 T Entrance 0.8 hr Forklift 2 S Raw material place 0.977 hr - 3 O Machine 3.081 hr - 4 S Finished product place 1.555 hr - 5 T Exit 0.5hr Forklift
Time sheet inside the machine 15 Task number Symbols Description of task Time taken Machinery required O I T S D 3.081 hr 1 O Feeder 0.699 hr - 2 O Printing 1.271 hr - 3 O Drying 0.349 hr - 4 O Cutting 0.540 hr - 5 O Stacking 0.222 hr
16 Inventory management Inventory management supervises the flow of goods from manufacturers to warehouses and from these facilities to point of sale. Inventory system is First in, first out (FIFO) The first in, first out (FIFO) method of inventory valuation is a cost flow assumption that the first goods purchased are also the first goods sold.
Plant Layout 17 Plant layout refers to the arrangement of physical facilities such as machinery, equipment, furniture etc. within the factory building. Based on production size and product variability, the appropriate layout to use in facility is Product layout.
From to Chart 18 From-to charts can be helpful in diagnosing problems related to the arrangement of departments and service areas, as well as the location of equipment within a given sector of the plant. From-to-chart: is a matrix that presents the magnitude of material handling that takes place between two facilities per time period. we use different scenarios to get the best scenario, which contains less distance between departments.
Scenarios we used 19 Scenario 1 Distance between each tow department Entrance Raw Material Exit Finished Product Machin e Entrance - 28.35 45.15 79 18.95 Raw Material 28.35 - 44.15 51.85 44.1 Exit 45.15 44.15 - 12.7 76 Finished Product 79 51.85 12.7 - 79.3 Machine 18.95 44.1 76 79.3 -
20 Sum the distances between each two departments Entrance Raw Material Exit Finished Product Machine Entrance - 56.7 90.3 158 31.9 Raw Material - 88.3 103.7 88.2 Exit - 25.4 152 Finished Product - 158.6 Machine - Total Distance = 56.7+90.3+158+31.9+88.3+103.7+88.2+152+25.4+158.6 = 951.3 m
21 Scenario 2 Scenario 3 T.D = 972.6 m T.D = 873.4 m
22 Scenario 4 Scenario 6 T.D = 899.3 m T.D = 996.6 m
The best scenario 23 Scenario 5 Total Distances = 872.5 m The best scenario is the fifth scenario which is based on the assumption of removing the separating wall between departments.
Economic Feasibility study 24 Assumption Number of Working Days in a year 1 300 Days study that analyzes data to determine whether the cost of the prospective new venture will ultimately be profitable to the company. 2 3 4 5 Number of Shifts in a day Hours in a Shift Depreciation Manpower One 8 hours Straight Line Method According to project Requirement On the basis of current market price of the area Local Industries / Enterprises demand of the area 572000 unit/month 6 Rent estimate 7 Potential Area of Marketing the products Number of cardboard sheets per month 8 9 proportion of damaged 1% 10 Number of good cardboard sheets per month 566280 unit/month 11 The price per ton of cardboard The amount of daily production based on order assuming the price for one finished cardboard 250$/ton 12 16 ton/day 13 0.384 $
25 Expenses in the production line Description Quantity (per month) Expenses(per month) Row cardboard sheets 400 ton 100000$ Plant rent 1997.375 m 5000$ Machinery &equipment - 119200$ Ink &packaging material 5000$ Staff &labor 4 3895$ Depreciation 532.9$ Other expenses 14200$
Working capital(per month) 26 S.N Description Amounts($) 1. Raw material 105000 2. Salaries & Wages 3895 3. Other Expenses 14200 Total 123095$ Total Capital Investment Capital Investment Amount($) Machinery & Equipment 119200$ Working capital for one year 1477140 $ Rent of factory 60000 $ Total 1656340 $
Cost of production 27 Cost of production value($) Total working cost per year 1477140 Depreciation on machinery & equipment 6395 Total 1483535$ Sales revenue S.N Item Qty (unit) Value($) 1 Cardboard sheets ready 6795360 unit 2609418.24 $ 2 Total 2609418.24 $ Break even analysis Break Even Analysis Fixed Cost revenue per unit value 128645 $ 0.384 $ 1 2 Variable Cost per unit Break Even volume Break Even volume 0.03 $ 3 363404 unit/monthly 254.13 ton/monthly 4 5
28 Payback Period Profitability guide Description Equation value Payback Period Pp= initial investment/ annual net cash flow without depreciation 1.46 year cost per cardboard sheet cost per sheet = production cost per year/# of sheets per year 0.216 $ Profitability guide Profitability guide = the present value of inflows/the present value of out flows 1.77
Conclusion 29 In this project, we collected data about (NCI), conducted relevant literature review, and made some final decisions related to facility layout, production planning and economic feasibility study. found that establishing the new production line at (NCI) is feasible with a payback period = 1.46 year, break-even point = 363404 unit/month, Profitability guide = 1.77
30 Recommendations Based on the number of products and material flow on production line, the production system is mass production (flow line production). The company does not need to purchase a new machine to perform the same function, because selected machine does not operate at its full capacity. There is unused space within the production line, which may be exploited through setting up a new different production line in the future.
31 The company can exploit the empty spaces within the production line by placing safety stock, to avoid problems in the emergency case. Advising the company to know maximum capacity of the production line, in order to decide if they can make a contractor with other companies and produce additional orders or not. We recommend the company to give attention to the results of feasibility study: the right price for sale of carton board and the minimum amount to be produced. Through production planning; the factory can avoid over production or under production.
32 Thank You


:U=Q/PCw")


")