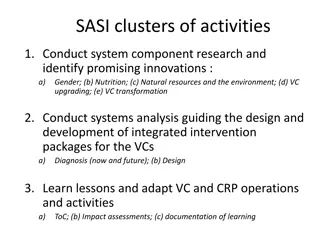
Analyzing Global Value Chains Overview
Motivation, insights, statistics, and collaborations related to analyzing global value chains, including the role of science and technology industries in supply chains, utilization of TiVA statistics, and international engagement efforts for global value chain statistics.
Uploaded on Mar 12, 2025 | 3 Views
Download Presentation

Please find below an Image/Link to download the presentation.
The content on the website is provided AS IS for your information and personal use only. It may not be sold, licensed, or shared on other websites without obtaining consent from the author.If you encounter any issues during the download, it is possible that the publisher has removed the file from their server.
You are allowed to download the files provided on this website for personal or commercial use, subject to the condition that they are used lawfully. All files are the property of their respective owners.
The content on the website is provided AS IS for your information and personal use only. It may not be sold, licensed, or shared on other websites without obtaining consent from the author.
E N D
Presentation Transcript
New Data for Analyzing Global Value Chains Tom Howells December 11, 2020 FESAC
Overview Motivation International Engagement Single-Country Trade in Value Added (TiVA) Statistics Extensions 2 3/12/2025
Motivation TiVA statistics provide unique insights: How much does the U.S. export? How much do we import from China? Where are the electronics that we consume produced? 3 3/12/2025
Motivation United States: 29% Japan: 29% Taiwan: 20% Europe/Korea/Other: 19% China: 4% Dedrick, Linden, and Kraemer 4 3/12/2025
International Engagement to Support Global Value Chain Statistics OECD-WTO o Ongoing support for world TiVA database o Engagement with Expert Group on Extended Supply-Use Tables Asia Pacific Economic Cooperation (APEC) o Development of APEC regional TiVA statistics o Regional capacity building efforts North America o Collaboration to develop a North America regional TiVA database o Bilateral trade asymmetries 5 3/12/2025
New BEA/NSF Collaboration BEA engaged in a new collaboration with the National Science Foundation (NSF) Goal: Better understanding of the role of science & technology (S&T) industries in domestic and global supply chains Approach: BEA is working with NSF s National Center for Science and Engineering Statistics (NCSES) to develop U.S. TiVA statistics in a single-country framework and to expand the coverage of S&T industries in BEA s industry statistics 6 3/12/2025
Multi-country TiVA framework Advantages of the multi-country framework: o Traces supply chain through direct and indirect U.S. trade partners o Captures exported U.S. value that returns home embedded in U.S. imports o Eliminates double counting of intermediate inputs that cross borders multiple times Disadvantages of the multi-country framework: o High level of international coordination required o Timeliness limited by statistical schedules in other countries o Level of detail limited by data availability in other countries o Changes to U.S. data required to reconcile discrepancies with other countries 7 3/12/2025
Single-Country TiVA Framework Key goal of BEA/NSF collaboration is to explore development of TiVA statistics in a single-country framework: o Rely primarily on the U.S. supply-use tables o No direct use of a multi-country supply-use framework By limiting reliance on a multi-country framework: o Greater timeliness o Higher level of detail o Greater consistency with official statistics 8 3/12/2025
Value Chain: Gasoline and Other Motor Fuel (Billions of Current Dollars) 450 400 350 300 250 200 Domestic Production 150 100 50 Imports 0 1997 1999 2001 2003 2005 2007 2009 2011 2013 2015 2017 2019 U.S. Bureau of Economic Analysis 9 3/12/2025
Value Chain: Gasoline and Other Motor Fuel (Billions of Current Dollars) 450 400 350 300 Goods Domestic Production 250 200 Wholesale, Retail, Transportation 150 100 Other Services Government Embedded Imports 50 0 Direct Imports 1997 1999 2001 2003 2005 2007 2009 2011 2013 2015 2017 2019 U.S. Bureau of Economic Analysis 10 3/12/2025
Value Chain: Gasoline and Other Motor Fuel (Billions of Current Dollars) 450 400 350 300 Goods Domestic Production Domestic Value 250 200 Wholesale, Retail, Transportation 150 100 Other Services Government Embedded Imports 50 0 Direct Imports 1997 1999 2001 2003 2005 2007 2009 2011 2013 2015 2017 2019 U.S. Bureau of Economic Analysis 11 3/12/2025
Extensions: Bilateral Trade Incorporate bilateral trade data into single-country TiVA framework Show breakout of direct and indirect imports by partner Decomposition into major trading partners: Canada, Mexico, China, Europe, Other 300 Value Chain: Gasoline and Other Motor Fuel 450 400 350 250 200 150 100 50 Imports 0 U.S. Bureau of Economic Analysis 12 3/12/2025
Expanded Trade in Services Categories in 2020 Expanded major service categories from 9 to 12 Expanded service types from 49 to 67 (not including aggregates) Introduced FISIM and market making services to address coverage gaps in financial services Improved coverage of certain service categories o Intellectual property services, e.g. by distinguishing charges for the use, reproduction and/or distribution, and outright sales of intellectual property o Improved categorization of audiovisual services by moving it to a new personal, cultural, and recreational services category 13 3/12/2025
Expanded Annual Geography in 2016 More than doubled annual geographic detail from 33 to 72 countries 14 3/12/2025
Extensions: Expanded Detail As part of BEA/NSF agreement, expand industry detail beyond current 71-industry detail to better highlight R&D and science & technology industries Moving toward annual publication of benchmark-level detail (roughly 400 industries and commodities) Expanded GDP by industry statistics published annually at 138- industry level beginning in 2018 15 3/12/2025
Extensions: Extended Supply-Use Tables BEA SUTs based mainly on o Economic Census data o Census and BEA trade data BEA AMNE data for MNE classification Microdata linking combines datasets and allows a breakdown by ownership and multinational status: o Domestic MNEs (U.S. Parents) o Foreign MNEs (U.S. Affiliates) o Non MNEs 16 3/12/2025
Extensions: Other Extensions Other possible extensions: oDecomposition of value added into capital and labor services oDecomposition of capital services by type of asset oReal TiVA statistics oHybrid model 17 3/12/2025
Questions Which research paths are most interesting and most beneficial for data users, policymakers, etc.? How should BEA package these statistics to make the data most useful for users? What are your priorities for new and expanded statistics to fill data gaps on international trade? 18 3/12/2025
Contact Information Tom Howells thomas.howells@bea.gov 301.278.9586 19 3/12/2025
