Analyzing Hurricane Karl (2010): Doppler Radar Insights
Detailed analysis of Hurricane Karl (2010) using Doppler radar and WRF simulations, focusing on precipitation patterns over Mexican terrain and underlying processes. Includes NASA and NOAA grants, airborne radar measurements, WRF simulations, flight tracks, and velocity distributions comparison between upslope and downslope segments.

Download Presentation

Please find below an Image/Link to download the presentation.
The content on the website is provided AS IS for your information and personal use only. It may not be sold, licensed, or shared on other websites without obtaining consent from the author.If you encounter any issues during the download, it is possible that the publisher has removed the file from their server.
You are allowed to download the files provided on this website for personal or commercial use, subject to the condition that they are used lawfully. All files are the property of their respective owners.
The content on the website is provided AS IS for your information and personal use only. It may not be sold, licensed, or shared on other websites without obtaining consent from the author.
E N D
Presentation Transcript
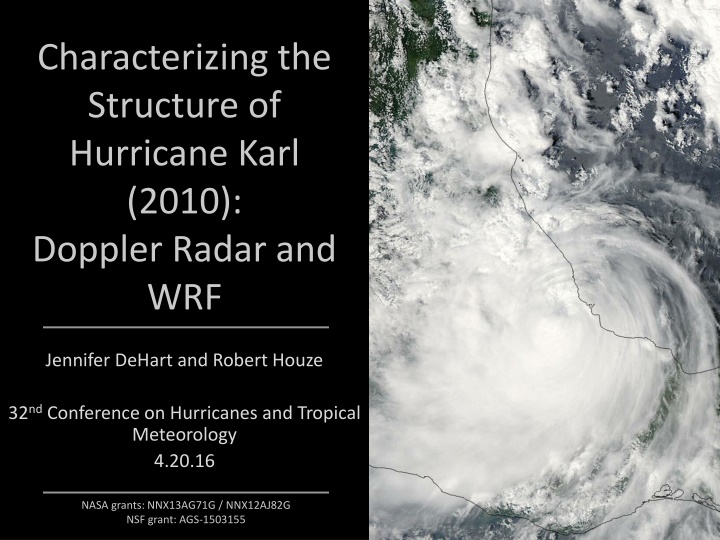
Characterizing the Structure of Hurricane Karl (2010): Doppler Radar and WRF Jennifer DeHart and Robert Houze 32ndConference on Hurricanes and Tropical Meteorology 4.20.16 NASA grants: NNX13AG71G / NNX12AJ82G NSF grant: AGS-1503155
Karl Best Track and Flights Flight Image: NHC
Rainfall and Mexican Terrain Intense rainfall collocated with eastern edge of Mexican terrain Maximum rainfall measured near Misantla Image: David Roth, NOAA
Science Questions What do airborne radar measurements indicate about the nature of the precipitation during landfall over the mountainous terrain of Mexico? What can WRF simulations tell us about the underlying processes?
NASA GRIP DC 8 Flight Track 09/17/2010 Aug. / Sept. 2010 Key instrument: APR-2 radar on DC8 -10 km flight level -Ku / Ka band -high resolution -downward pointing -cross-track scan
Upslope Segment Minutes after 1800 Z Low-level enhancement present in reflectivity data Warm-rain process
Downslope Segment Minutes after 1900 Z Low-level enhancement not present Fall streaks from melting ice aggregates
Upslope and Downslope Segments Compare reflectivity and hydrometeor velocity distributions between upslope and downslope flight legs
Anomaly frequency diagram Upslope segments minus downslope segments Beams affected by attenuation have been removed Velocity distribution for upslope segments shifted towards weaker hydrometeor velocities Larger particles fall quickly in downslope legs and upslope legs have weaker velocities small particles
WRF Details WRF 3.4.1 Initialized at 00Z on 9/15/2010 4 domains: 54, 18, 6, 2 km 2, 6 km domains follow vortex Microphysics: Goddard Boundary Layer: MYJ Levels: 70 Two runs: control and reduced terrain
Observed and Simulated Tracks Control run: traces observed track (storm motion too fast). Flat terrain run: track shifts northward.
Modeled Intensity Karl s intensity is underestimated, but general trend is captured Control Best Track Modified terrain run reaches deeper intensity and does not drop off as quickly Modified Terrain
Cloud Water Rain
Flat Terrain Rain Cloud Water Full Terrain
CONCLUSIONS Upslope flow produces enhanced near-surface reflectivity in Karl cloud water collected by falling raindrops velocity distributions shift to weaker speeds smaller drops falling slowly WRF simulations consistent enhanced cloud water and rain trace line of Mexican terrain vertical distributions shift towards greater hydrometeor mixing ratios