Analyzing Relationship Between Orientation and Reaction Time
Learn how to analyze the strength of the relationship between orientation and reaction time for each participant using correlation coefficients and one-sample t-tests in Excel. Steps include filtering incorrect trials, calculating average reaction times, and correlating them with stimulus orientation. Get detailed instructions with visuals for data processing and analysis.
Uploaded on | 0 Views
Download Presentation

Please find below an Image/Link to download the presentation.
The content on the website is provided AS IS for your information and personal use only. It may not be sold, licensed, or shared on other websites without obtaining consent from the author. If you encounter any issues during the download, it is possible that the publisher has removed the file from their server.
You are allowed to download the files provided on this website for personal or commercial use, subject to the condition that they are used lawfully. All files are the property of their respective owners.
The content on the website is provided AS IS for your information and personal use only. It may not be sold, licensed, or shared on other websites without obtaining consent from the author.
E N D
Presentation Transcript
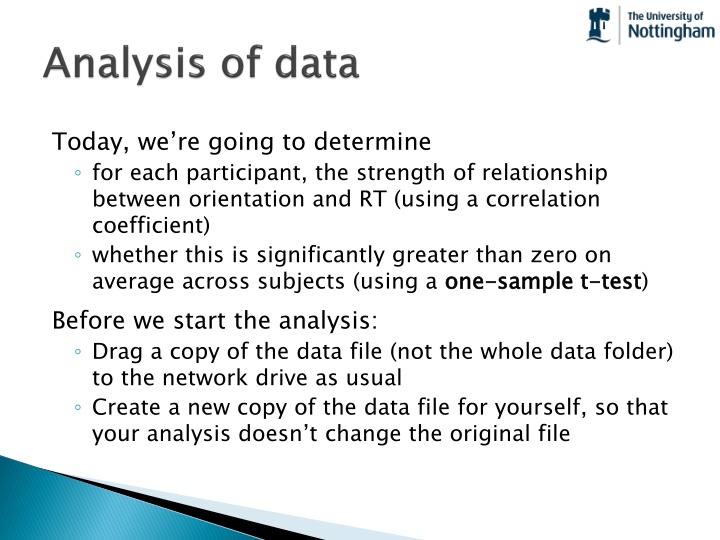
Today, were going to determine for each participant, the strength of relationship between orientation and RT (using a correlation coefficient) whether this is significantly greater than zero on average across subjects (using a one Before we start the analysis: Drag a copy of the data file (not the whole data folder) to the network drive as usual Create a new copy of the data file for yourself, so that your analysis doesn t change the original file one- -sample sample t t- -test test)
In excel we need to: get rid of the trials for the reversed stimuli (they might differ from trials with the normal stimuli) filter out incorrect trials take the average RT for the 4 remaining trials for each orientation (2 trials with G , 2 trials with R ) correlate this average RT with the orientation of the stimulus
Select the spreadsheet rows for stimulus revG.png Right click on them and select delete note that hitting the delete key on the keyboard doesn t work (that just empties the cells without getting rid of them) Do the same for revR.png
To filter out incorrect responses, we need to filter the resp.rt_raw (cols M and N) based on resp.corr_raw (cols G and H) In cell R2, create a filter by typing: =IF(G2=1,M2,"") Auto-fill this downwards, to fill the rest of the R column (the 1strepeat of each stimulus) Then auto-fill this to the right, which will create a similar column for the 2ndrepeat of each stimulus
To make things easier, copy over the orientation column(col B) to column Q Select and drag the filtered data (cols R,S) from R.png trials to sit next to the right of the G trials Label the columns from R to U so you remember what they are (e.g. G1, G2, R1, R2 for the 1st2nd trials of R and G )
Create a new column heading, meanRT in Column V In this, create the average of the previous 4 columns where the value is blank (because of an incorrect response) this won t be included in the average
(You could copy your two columns to SPSS and do the following there if you prefer) Create an XY scatter plot of the two variables: Select the rotation and meanRT columns (select one, press and hold Ctrl, then select the other) Insert chart, X-Y scatter (for fun, Microsoft moves this to a different location in every version of Excel you ll just have to search!) Excel can do very basic stats, such as correlation coefficients: In a new cell type =correl(Q2:Q20,V2:V20) or go to >insert>function (if you can find it!)
As usual, you will need various details about the experiment, which you can fetch from PsychoPy e.g.: How long was each component presented (e.g. fixation cross) on? How many/what stimulus conditions? Spend some time now fetching those details
If, on average, there is no (straight line) relationship between orientation and RT, then on average r will be 0 To test if r is, on average, different from 0 we can perform a one-sample t-test comparing r with 0 You will also need information about the number of subjects and mean age etc.
