Analyzing Voter Turnout Trends in Israeli Knesset Elections 2020 vs. 2021
Delve into the shifts in voter turnout in Israeli Knesset elections, comparing 2020 and 2021. Explore the impact on different population sectors, localities, and political affiliations, revealing intriguing insights into voting patterns and party support changes.

Download Presentation

Please find below an Image/Link to download the presentation.
The content on the website is provided AS IS for your information and personal use only. It may not be sold, licensed, or shared on other websites without obtaining consent from the author. If you encounter any issues during the download, it is possible that the publisher has removed the file from their server.
You are allowed to download the files provided on this website for personal or commercial use, subject to the condition that they are used lawfully. All files are the property of their respective owners.
The content on the website is provided AS IS for your information and personal use only. It may not be sold, licensed, or shared on other websites without obtaining consent from the author.
E N D
Presentation Transcript
Voting Patterns in Knesset Elections: 2021 Vs. 2020 PROF. OFER KENIG The Israel Democracy Institute
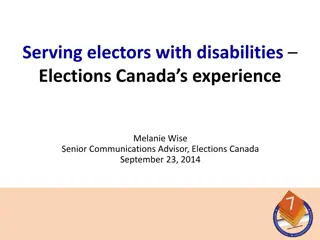
Where did voter turnout decline most? Drop in voter turnout between 2020 and 2021 (percentage points) Kibbutzim Well-off cities in the center Tel Aviv Settlements Ultra-Orthodox Likud cities Jerusalem Development towns Arabs -0.2 -1.3 -1.7 -2.5 -3.9 -4 -4.2 -4.9 -20.2 To a great extent, this single slide tells almost the entire story of the 2021 elections. Lower voter turnout was recorded among all population sectors and all localities, but to a different extent in each something which had a highly significant impact. In places identified with the Center-Left (kibbutzim, upper middle class cities in the center of Israel, Tel Aviv), the decline was minimal. By contrast, in places identified with the Right (settlements over the Green Line, cities which are considered Likud strongholds, development towns, Jerusalem), the decline was more significant. Among the Arab population, the drop in voter turnout was dramatic and unprecedented.
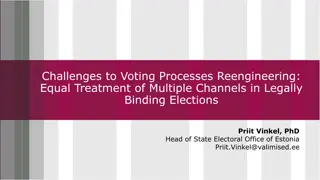
Voter turnout: 2020 2021 61.7% 60.0% Tel Aviv 48.2 50 40 30 22 21.9 20 17 14.8 14.5 14 10.7 10 4.2 3.7 3.2 0 Blue and White Yesh Atid Likud Labor-Gesher-Meretz Labor Meretz Yisrael Beytenu New Hope 2020 2021 Almost half of Tel Aviv voters voted for Blue and White in 2020. This time, the winner was Yesh Atid (22%), but even if we add the votes cast this time for Gantz, this still only comes to around 33%. Where did the rest go? They returned home to Labor and Meretz, whose combined share rose by more than 14% of the vote, as compared to 2020, when they ran together as a single electoral list (together with Orly Levy s Gesher party). The Likud lost 5% of the vote, most of which seems to have moved over to Gideon Sa ar s New Hope party.
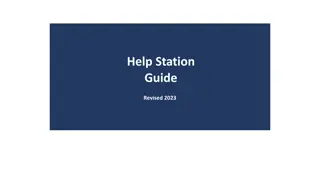
Voter turnout: 2020 2021 58.3% 55.1% Haifa 40 34.6 26.6 30 21.4 19.5 20 10.3 10.3 9.3 8.1 7.5 7.2 6.8 6.3 10 5.5 0 2020 2021 While the Likud gained the highest number of votes in Haifa, its share of the total votes declined by more than 5 percentage points relative to the previous elections. Presumably, at least some of these Likud voters switched to New Hope. Total support for Yesh Atid and Blue and White was 7 percentage points lower than in 2020, with almost all these votes moving to Labor and Meretz. The low voter turnout in the Arab sector was reflected in a moderate decline of less than 3 percentage points in support for the Arab parties. 20.03.2025
Voter turnout: 2020 2021 63.3% 59.1% Jerusalem 30 27.8 24.4 23.6 20.6 20 17.1 15.8 12.5 9.3 8.6 10 6.7 5.6 3.3 0 Likud United Torah Judaism Shas Yamina Religious Zionism Blue and White Yesh Atid 2020 2021 As in the September 2019 elections, United Torah Judaism once again managed to defeat Likud in the capital and garner the largest number of votes. Likud lost more than 7% of the vote relative to the previous elections. These voices shifted mainly to Yamina and Religious Zionism, whose combined share increased by more than 7% of the vote, compared with 2020. 20.03.2025
Voter turnout: 2020 2021 Ultra-Orthodox Sector (based on results in Elad, Beitar Illit, and Modi in Illit) 83.6% 79.7% 70 62.4 60.1 60 50 40 31.4 29.3 30 20 7.2 10 4.1 1.9 1.4 0.5 0 United Torah Judaism Shas Likud Yamina Religious Zionism 2020 2021 The trends seen in the ultra-Orthodox sector are a clear reflection of the overall shifts in the Netanyahu bloc. All the parties lost votes compared with 2020, and these votes were picked up by Religious Zionism. At the same time, the magnitude of this change should not be overstated. Overall, United Torah Judaism lost less than 2.5% of the vote, and Shas, only 2.1%. 20.03.2025
Voter turnout: 2020 2021 66.8% 61.9% Development Towns* Towns built in Israel during the 1950s subsequently considered by some to be places of relegation and marginalization 50 46.6 39.3 40 30 20 14.6 14 13.8 9.3 8 10 7.2 6.3 5.6 4.3 3.9 0 Likud Shas Blue and White Yesh Atid Yisrael Beytenu Yamina Religious Zionism 2020 2021 Along with a drop of more than 7 percentage points in support for the Likud, there was also a significant decline in voter turnout. The meaning of such a decline is that many Likud voters decided to stay home this time. In absolute terms, Likud lost almost 25,000 votes in development towns. 20.03.2025
Voter turnout: 2020 2021 74.9% 72.4% Settlements (not including the two ultra-Orthodox cities in the West Bank) 45 38.7 40 35 30.2 30 27 25.5 25 17.9 20 15 11.8 11.6 8.9 10 5.8 4.8 2.9 5 1.9 0 Yamina Otzma Yehudit Likud Shas + United Torah Judaism Blue and White Yesh Atid New Hope 2020 2021 Claims that Netanyahu s campaign to whip up votes for Religious Zionism was too successful, are clearly supported by voting patterns in the settlements. Likud lost its status as the largest party, as its share of the vote plummeted by more than 13 percentage points. The big winner was Religious Zionism, which became the strongest party in the territories over the Green Line, even at the expense of votes for the ultra-Orthodox parties (whose combined share fell by around 3% of the vote). 20.03.2025
Voter turnout: 2020 2021 71.3% 71.1% Kibbutzim (not including the two ultra-Orthodox cities in the West Bank) 70 58 60 50 40 28.1 25.6 30 23.2 18.9 20 13.4 8.2 6.3 3.7 10 0 2020 2021 In the 2020 elections, Blue and White took more than 58% of the vote in kibbutzim, a remarkable achievement. In this round, , Blue and White and Yesh Atid together received only 36% of the vote, with the remainder mainly moving back to the two parties that have traditionally enjoyed strong support in kibbutzim: Meretz and Labor; the latter regained its position as the largest party for the first time in several elections. 20.03.2025
Voter turnout: 2020 2021 64.8% 44.6% Arab Sector (not including "mixed" Arab-Jewish cities) 100 87.6 90 80 70 60 50 41.8 38.3 40 30 20 5.2 10 3.7 2.2 1.8 0.9 0 Joint List Ra'am Likud Labor-Gesher-Meretz Labor Meretz 2020 2021 Apart from the huge decline in voter turnout, what was most prominent in the Arab sector was the impressive performance of Ra am, which gained almost as much support as the other three Arab parties combined (Hadash, Ta al, Balad), which together made up the Joint List. Netanyahu s attempts to attract significant support from Arab voters were not particularly productive. While support for Likud grew by more than 3 percentage points, due to the drop in voter turnout, this was an increase of only 10,000 extra votes in total - less than a third of a Knesset seat. 20.03.2025
Voter turnout: 2020 2021 62.9% 58.9% Likud Strongholds (Ashdod, Ashkelon, Be er Sheva, Hadera, Holon, Netanya) 50 43.7 40 36.1 30 21.6 20 12.4 11.8 11.1 10.1 10 10 6.1 5.6 5.5 4.1 3.7 0 Likud New Hope Shas Yisrael Beytenu Blue and White Yesh Atid Yamina Religious Zionism 2020 2021 Alongside a drop of more than 7 percentage points in support for Likud, there was also a decline in voter turnout which further contributed to Likud s weak result. In absolute terms, Likud lost almost 53,000 votes in the six cities analyzed here, representing one-and-a-half Knesset seats. These voters shifted to New Hope, Yamina, and Religious Zionism, or simply stayed at home. By contrast, the decline in support for Blue and White and Yesh Atid combined (compared with Blue and White in 2020) was more moderate. 20.03.2025
Upper-Middle Class Cities in the Center of Israel (Givatayim, Hod Hasharon, Modi in, Kfar Saba, Ramat Gan, Ra anana) 60 Voter turnout: 2020 2021 49.2 70.3% 69.0% 50 40 26.6 25.3 30 19.9 20 11.4 10.4 9.8 7.6 7.4 6.2 5.5 10 3 0 2020 2021 Not surprisingly, Yesh Atid took first place in voting in well-established cities in the center of Israel. However, the combined share of the vote for Lapid and Gantz this time (around 37%) was much lower than that won by Blue and White in 2020. These votes mainly went to Labor and Meretz, and a minority to New Hope, which did better in these cities than it did nationally. Likud lost around 7% of the vote, with its voters opting instead for Yamina, Religious Zionism, and Gideon Sa ar. 20.03.2025