Angiography and PCI Centers in Austria 2012
Explore data on angiography and PCI centers in Austria in 2012, including the number of locations and rooms, monitoring reports, practice patterns, and trends in coronary procedures. Detailed information on angiography frequencies, PCI rates, and related statistics are presented in this comprehensive report.

Uploaded on | 0 Views
Download Presentation

Please find below an Image/Link to download the presentation.
The content on the website is provided AS IS for your information and personal use only. It may not be sold, licensed, or shared on other websites without obtaining consent from the author. If you encounter any issues during the download, it is possible that the publisher has removed the file from their server.
You are allowed to download the files provided on this website for personal or commercial use, subject to the condition that they are used lawfully. All files are the property of their respective owners.
The content on the website is provided AS IS for your information and personal use only. It may not be sold, licensed, or shared on other websites without obtaining consent from the author.
E N D
Presentation Transcript
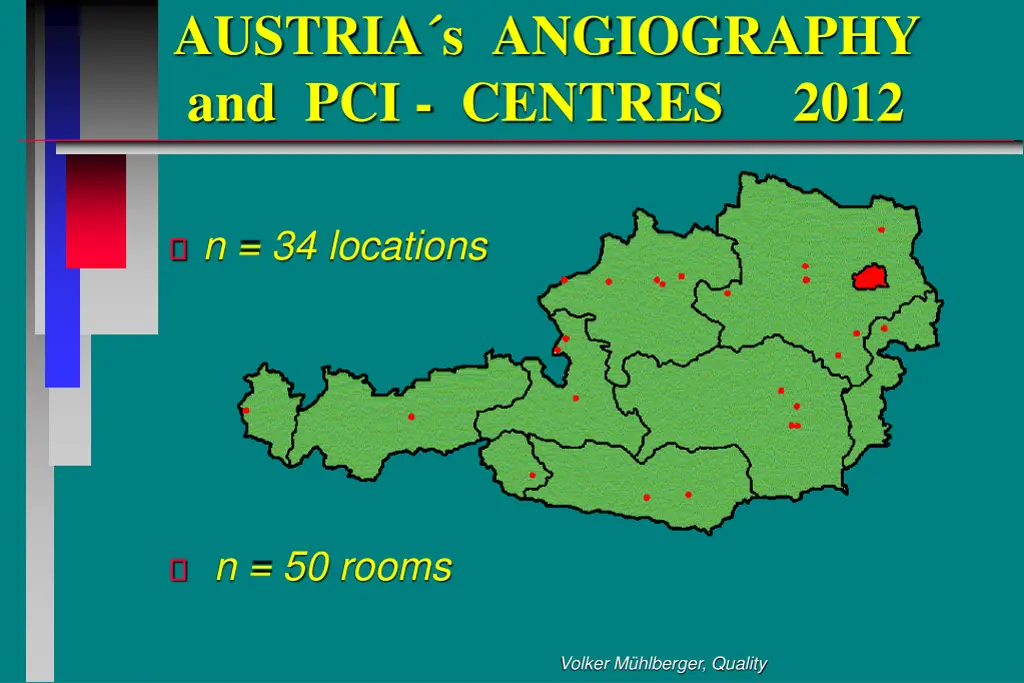
AUSTRIAs ANGIOGRAPHY and PCI - CENTRES 2012 n = 34 locations n = 50 rooms Volker M hlberger, Quality
Monitor (Auditor) Report: 1989 2013 http://iik.i-med.ac.at L.Kaltenbach, H. Ulmer, C.Kobel www.kardiologie.insel.ch/2164.html B Meier,Micha T. Maeder, Gregor Fahrni Basel www.ptca.ch www.herzbericht.de E.Bruckenberger T.Meinertz Herzstiftung ab 2011 sterreichische Spezialregister Volker M hlberger, Quality
(Versorgungsforschung ) to describe practice patterns and trends, to identify outliers and to detect safety signals Lauer MS, D Agostino RB NEJM 2013; 369:1579-81 Volker M hlberger, Quality
AUSTRIA 2011 / 2012 Angiography 53.808 53.064 PCI 20.295 20.543 - stent - - DES 78% 85% 91% 90% OP-CAD (Bruckenberger : 2008=4.248) Schistek 2.737 OP- valve (Bruckenberger: 2008=2.280) Schistek 2.583 Volker M hlberger, Quality
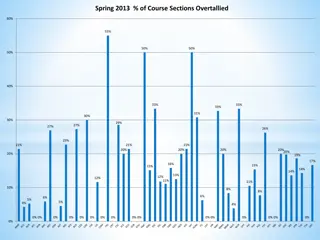
NUMBER OF CENTERS with <400 CA /year vs. <200 PCI/year vs. CA/y(*t) 12 7 6 10 5 8 4 6 3 4 <400 CA/y+c 2 <200 PCI/y+c 2 1 CA/y x thousand 0 0 2000200120022003200420052006200720082009201020112012 Volker M hlberger, Quality
Number of tables, CENTERS and Centers with > 36 STEMI - PCI / year 60 50 40 30 27 24 23 23 23 22 20 20 19 18 20 centers tables 10 0 2003 2004 2005 2006 2007 2008 2009 2010 2011 2012 >36 STEMI-PCI/y+c Volker M hlberger, Quality Silber 2005 / DiMario 2006; ESC
Coronary Angiography Frequency per Million Inhabitants 1992-2012 12000 10000 8000 AU 8.12-8.43 CH 7.4 - 7.95 D 82.2-81.8 CZ 10.0-10.5 SL 5.5 -5.4 6000 4000 2000 0 Volker M hlberger, Quality
% PCI/ CA 1992 - 2012 (AU/CH/D/CZ) 50 45 40 35 30 AU 25 CH 20 D 15 CZ 10 5 0 Volker M hlberger, Quality
PCI per One Million Inhabitants (AU/CH/D/CZ/SL/USA) 1992-2012 4500 4000 USA 3500 3000 2500 2000 1500 SL 1000 AU 500 CH 0 D CZ Volker M hlberger, Quality
Bifurcation PCI, left main stent Austria (% of PCI reporting centers only -2012) 9.0 8.0 7.0 6.0 5.0 left main stent bifurcation pci 4.0 3.0 2.0 1.0 0.0 2008 2009 2010 2011 2012 Volker M hlberger, Quality
PCI Frequency in Austria 2006-2011 acute or non-acute Indications 25000 20543 20294 20295 19856 19727 19342 19263 20000 15000 13517 13349 13828 13073 13041 NICHT AKUT AKUT PCI 13328 14254 10000 5000 7026 6946 6783 6686 6466 6014 5009 0 2006 2007 2008 2009 2010 2011 2012 Volker M hlberger, Quality
Acute PCI/ STEMI PCI / (n=) Austria 2007 2012 % 8000 7000 STEMI 6000 5000 "acute" 4000 STEMI % x10 3000 2000 50 % 55 % 1000 0 2007 2008 2009 2010 2011 2012 Volker M hlberger, Quality
ACUTE PCI (% of total PCI) in AU, CZ, EU, CH (=STEMI only) 50 45 40 35 30 AU acute CH STEMI EU CZ CH acute AU STEMI 25 20 15 10 5 0 Volker M hlberger, Quality
% GP IIb/IIIa for PCI (AU/CH) % dir.ThrombinInhibitor (TI-AU) 30 25 20 AU CH AU-TI 15 10 5 0 Volker M hlberger, Quality
PCI Hospital-Mortality (%) in Austria, Switzerland,Germany, EU 2.5 2 1.5 AU CH D EU 1 0.5 0 Volker M hlberger, Quality
PCI -Mortality (%) in Austria 2011 /2012 25 20 15 10 5 0 PCI gesamt PCI nicht-akut PCI akut PCI akut ohne Schock PCI akut + Schock Volker M hlberger, Quality
PCI -Mortality (ref.=overall-% mortality in Austria) (non-acute / without /with shock) 1.20 1.00 0.80 non-acute PCI bezogen auf Gesamt PCI 0.60 0.40 PCI for MI without Shock bezogen auf Gesamt PCI PCI for MI with Shock bezogen auf Gesamt PCI 0.20 0.00 Volker M hlberger, Quality
Intra aortic balloon pump for PCI in Austria 2006 -2012 (CH 2012) 500 450 400 350 300 AUT CH 250 200 150 100 50 0 2005 2006 2007 2008 2009 2010 2011 2012 Volker M hlberger, Quality (R. Zweiker)
DRUG ELUTING stents (DES) in AU,CH,D,EU-CZ (% of stents) 100 90 80 70 60 50 AU CH D EU CZ CZ 40 30 EU EU 20 10 0 Volker M hlberger, Quality
REDO for all chronic Restenoses vs. Thrombus reporting centres (n/%) Thrombus Restenose Thrombus x10% reporting centres 1000 800 600 400 15,2% 15,1 % 200 8,5% 11,9% 0 2007 2008 2009 2010 2011 2012 Volker M hlberger, Quality
DES/stent and chronic Re-Stenosis REDO reporting Centres (% of stent) DES % REDO % (reporting Centers only) 90 80 70 60 50 40 30 20 5.04 5.0 6.6 6.3 10 0 20022003200420052006200720082009201020112012 Volker M hlberger, Quality
Ratio of emergency CABG due to PCI (%): Austria/Switzerland/EU 1.4 1.2 1 0.8 AU CH EU 0.6 0.4 0.2 0 Volker M hlberger, Quality
Puncture site closing devices (% of ..) AUT 2011 / 2012 80 70 60 50 40 30 20 10 0 % of PCI % of CA % of PCI nonacute % of PCI acute Volker M hlberger, Quality
Severe bleeding (% of ..bleeding reporting only) AUT 2010 / 2011 / 2012 40 35 30 25 20 15 10 5 0 % of CA % of PCI nonacute % of PCI acute Volker M hlberger, Quality (J. D rler)
Non- femoral Approach 2011/2012 (% of procedure) in Austria 25 20 15 2011 10 2012 5 0 Volker M hlberger, Quality (J.Schuler)
Non-femoral Approach (% of PCI) in AU/ french or german-CH 70 60 50 40 AU CH french CH german CH CZ 30 20 10 0 Volker M hlberger, Quality
% -multivessel PCI Austria / EU / CH 25 20 15 AU CH EU 10 5 0 Volker M hlberger, Quality (F.Weidinger)
AUT 2012 CH 12 10 8 6 AUT 4 CH 2 0 Volker M hlberger, Quality (G.Friedrich; G.Delle Karth; R.Berger))
AUT 2012 CH 900 800 700 600 500 400 300 AUT CH 200 100 0 Volker M hlberger, Quality (W. Tkalec; M.Knoflach)
Austria vs. CH 2002 LAA closure 2012 200 180 160 140 120 AU CH 0 100 80 60 40 20 0 2002 2003 2004 2005 2006 2007 2008 2009 2010 2011 2012 Volker M hlberger, Quality
OLD and NEW DEVICES (<350/a) Austria 2002-2012 400 350 300 250 MitraClip Thrombin lokal NOGA mapping REnalDenerv PTSMA 200 150 100 50 0 Volker M hlberger, Quality
OLD and NEW DEVICES (<3500/a) Austria 2002-2012 3500 3000 ( Catheter Thrombectomy or DE Balloon 2500 2000 1500 Defektverschl. 1000 500 0 Volker M hlberger, Quality
OLD and NEW DEVICES (35.000/a) Austria 1992 -2012 40000 35000 30000 STENT DES 25000 20000 IVUS ROTABL i.c.PRESSURE 15000 10000 5000 0 Volker M hlberger, Quality
Myocardial Biopsies in Austria 2006 -2012 myocardial biopsies 450 400 350 300 250 200 150 100 50 0 2006 2007 2008 2009 2010 2011 2012 Volker M hlberger, Quality
Ablation (n) / Electrophysiology (n; %) in CathLab Implantations / Austria Ablation Diagnostics A/D % x10 Implantation 3500 3000 2500 2000 1500 100 % 72% 1000 500 0 2003 2004 2005 2006 2007 2008 2009 2010 2011 2012 Volker M hlberger, Quality
Transcatheter aortic valve implantation (TAVI; n = ) in AU, CH -2012 650 700 Balloon only Transapical Valve Transarterial AU- TAVI Edwards Sapien CorValve CH- TAVI 600 501 500 397 432 400 300 200 100 0 0 0 2005 2006 2007 2008 2009 2010 2011 2012 Volker M hlberger, Quality (E.Maurer; W.Wisser)
sterr.Kardiol.Gesellschaft 19892013 Arbeitsgruppe Intervent. Kardiologie As presented, discussed and accepted at the KG - Meeting in LINZ, November 22nd 2013
Thank You DANKE SEHR Volker M hlberger, Quality
PCI during Diagnostic Angio (%) in Austria / Switzerland / EU 100 90 80 70 60 AU CH EU 50 40 30 20 10 0 Volker M hlberger, Quality
PCI Mortality acute PCI with shock in Austria (ref.= reporting centres only until 2011) mort. PCI shock % 40 35 30 25 20 mort. PCI shock % 15 10 5 0 2003200420052006200720082009201020112012 Volker M hlberger, Quality
Ratio of STENTING per PCI (%) in AU/CH -2011/D/CZ 100 90 80 70 60 50 AU 40 CH 30 D 20 CZ 10 0 Volker M hlberger, Quality
Puncture site closing devices (% of PCI in AU/CH) 80 70 60 50 40 AU CH 30 20 10 0 Volker M hlberger, Quality
EMERGENCY CABG AFTER PCI (%): MORTALITY in Austria 50 46.7 45 40 36.4 36.4 35 32 28.6 30 26.1 25 23.1 25 18.2 18.2 20 15.416 13.6 15 1210.5 8.3 8.3 10 6.255.3 3.3 5 0 0 Volker M hlberger, Quality
OLD and NEW DEVICES (loser) Austria 2002-2011 Brachytherapie 163/101/28/3/0/0/0/0/0/0 Ultraschalltherapie 1/0/0/0/0/0/0/0/0/0 Transmyokardialer Laser 16/0/13/0/0/0/0/0/0/0 Spinal Cord Stimulation 4/0/0/0/0/0/0/0/0/0 Herzohrverschluss links 7/4/13/0/0/0/0/?/? Stammzellth. -Katheter 1/16/23/12/40/3/0/0/0 stereotaktische Drahtnavigation-/-/-/-/-/33 /13/4/0 Volker M hlberger, Quality
Non- femoral Approach 2010/2011 (% of procedure) in Austria 18.5 KAG 2011 18 17.5 PCI 2010 17 PCI 2011 16.5 15,7 16 PCI akut 2011 15.5 15 PCI elektiv 2011 14.5 14 Volker M hlberger, Quality
Intention to audit a center 5000 4500 4000 3500 CA 3000 2500 PCI 2000 1500 1000 500 0 2002 2003 2004 2005 2006 2007 2008 2009 2010 2011 Volker M hlberger, Quality
benchmarking: over the years Gesamt PCI Mortalit t % AT Gesamt PCI Mortalit t % 2.500 2.000 1.500 1.000 0.500 0.000 2000 2001 2002 2003 2004 2005 2006 2007 2008 2009 2010 2011 Volker M hlberger, Quality
benchmarking: over the centres 2010 PCI Mortalit t 3 2.5 2 1.5 1 0.5 0 0 5 10 15 20 25 30 35 40 Volker M hlberger, Quality
benchmarking: over the centres 2010 akut PCI mit Schock Mortalit t 120 100 80 60 40 20 0 0 5 10 15 20 25 30 35 Volker M hlberger, Quality
PCI Hospital-Mortality (%) in Austria true vs. traditional 1.6 1.4 1.2 1 alle meldende 0.8 0.6 0.4 0.2 0 2008 2009 2009 2010 2011 Volker M hlberger, Quality

 Report:")
")


 in")
")
 in")
")
")

")


")

")


")
")
")

 / Electrophysiology (n; %)")


")


")


 in")