Explore the concept of correlation in animal genetics and breeding, learning about the association between variables, types of correlation, and real-world examples like positive, negative, and zero correlations. Dive into the significance of direction, number of variables studied, and the implications in animal science research.
Please find below an Image/Link to download the presentation.
The content on the website is provided AS IS for your information and personal use only. It may not be sold, licensed, or shared on other websites without obtaining consent from the author. If you encounter any issues during the download, it is possible that the publisher has removed the file from their server.
You are allowed to download the files provided on this website for personal or commercial use, subject to the condition that they are used lawfully. All files are the property of their respective owners.
The content on the website is provided AS IS for your information and personal use only. It may not be sold, licensed, or shared on other websites without obtaining consent from the author.
E N D
Presentation Transcript
ANIMAL GENETICS & BREEDING UNIT I Biostatistics & Computer Application Lecture 8 &9 Correlation Dr K G Mandal Department of Animal Genetics & Breeding Bihar Veterinary College, Patna Bihar Animal Sciences University, Patna
Correlation Correlation: Association or relationship or interdependence between two or more variables. Variables: Continuous and discrete Attributes: qualitative traits Types of correlation 1.According to direction: (i) Positive (ii) Negative (iii) Zero
2. According to number of variables: (i) Simple (ii) Multiple (iii) partial 3. According to proportionate change between two variables: (i) Linear (ii) Non-linear
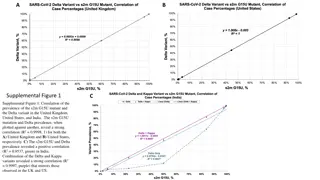
(A)According to direction: (i) Positive correlation Both the variables move in the same direction. Example 1. height and weight Height (inch) : 50, 51, 52, 53, 54, 55 Body wt.(kg) : 60, 61, 62, 64, 65, 67 Example 2. variable (X) : 60, 55, 50, 45, 40, 35, 30 variable (Y) : 40, 35, 30, 25, 20, 15, 10 Body weight increases with the increase in height. Both are moving in the same direction.
(ii) Negative correlation Both the variables move direction. Example Milk yield & fat percentage Daily M Y (kg): 10, 12, 14, 16, 17, 18, 20 Fat % : 6.5, 6, 5.5, 5, 4.5, 4.5, 4 One variable is increasing while the other is decreasing. With the increase in milk production, the fat % in milk is going down. in the opposite
(iii)Zero correlation increases or decreases but the other variable remains constant. Example 1. Variable X 2, 5, 6, 8, 10, 12 Variable Y 5, 5, 5, 5, 5, 5 Example 2. Variable X : 15, 12, 10, 8, 6, 4, 2 Variable Y : 6, 6, 6, 6, 6, 6, 6 With the increasing or decreasing in one variable there is no change in the second variable. One variable
(B) According to no. of variables: (i) Simple only two variables are studied at a time. Eg. Height & Body wt. (ii) Multiple three or more variables studied at a time. Example feed quality, quantity given, feed conversion, body weight, etc. (iii) Partial correlation studied three or more variables but find out correlation between two variables at a time while others kept constant. Eg. Correlation between crop yield and amount of fertilizer given while number of irrigation given is kept as constant.
( C)According to proportionate change between variables: (i) Linear - Both the variables move at a constant ratio throughout. Example: X 5, 10, 15, 20, 25 Y 10, 20, 30, 40, 50 constant ratio . (ii) Non-linear Variables do not follow a constant ratio throughout. Example: X = 10, 15, 20, 25, 30, 35, 40 Y = 8, 10, 12, 13, 18, 20, 25
Coefficient of correlation: It measures the degree of association or degree of interdependence relationship between variables. Denoted as r , i.e., rxy so that, rxy = ryx Concept given by Karl Pearson. or two or more
Properties of correlation coefficient: (i) Ranges from -1 to +1 (ii) Pure number (iii) No unit (iv) + 1 is perfect positive correlation (v) - 1 is perfect negative correlation (vi) when r = 0, it means no correlation (vii) rxy = ryx
Exercise No. 1. Estimate the coefficient of correlation between X and Y variables from the following data. X2 Y2 Sl. No. X Y XY 1. 2 4 2. 3. 4 6 6 8 4. 8 10 5. 10 12
Exercise no. 2. Calculate the coefficient of correlation between daily milk yield(kg) and fat percentage (%) in milk of following cows. Sl. No. DMY (X) Fat % (Y) X2 Y2 XY 1. 5 6.0 2. 6 6.0 3. 7 5.5 4. 8 5.5 5. 9 5.0 6. 10 5.0 7. 11 4.5 8. 12 4.0 9. 5 6.0 10. 6 6.0 Total
Rank correlation: i)It measures the degree of association between the ranks of two variables. ii) Concept given by Spearman. iii) No unit iv) Ranges from -1 to + 1 6 di2 n(n2 1) v) R = 1 -
Where, To avoid the mathematical complexity the differences between the ranks are squared. di = xi yi xi = ith rank of x variable yi = ith rank of y variable n = pair number of observation di = 0
Example: Estimation of rank correlation between the ranks of students secured for marks obtained in two subjects. AGB 605 Mid- term (x) Rank (Xi) Final (y) Rank (Yi) di = xi yi di2 A B C D E F 60 70 90 65 75 85 6 4 1 5 3 2 58 68 78 88 84 72 6 5 3 1 2 4 0 0 1 4 -1 -2 4 1 -2 16 1 4 Total di = 0 di2= 26
Standard Error (S.E.) of r : S. E. of r = (1- r2)/ N Probable Error (P.E.) of r : P.E.(r) = 0.6745 (1 r2)/ N If r < SE or PE, there is no correlation. If r > 6PE, the coefficient of correlation is said to be certain and significant.
Test of significance: Coefficient of correlation is tested through t test at N 2 d.f. T- test: ? (N 2) (1 r2) t (N-2) d.f. = Interpretation : The calculated value of r is compared with tabulated value of r at 0.05 and 0.01 significant levels for (n-2) df. Greater calculated r represents significant correlation.
Use of Correlation coefficient: i) Prediction of future performance on the basis of past record. y = Y + rSy Sx(x x) Where, y = predicted value of y y = mean of y r = correlation coefficient x = mean of x Sx & Sy = SD of x and y variables respectively
2. Measures the degree of relationship between two variables (characters). 3. The square of correlation coefficient between breeding value and phenotypic value (r2AP) measures the heritability. 4. It maintains regression. 6y 6x & 6y relationship with byx = rxy bxy = rxy6x
Exercise no. 3. One cow yielded 3000kg milk in her first lactation. Predict how much milk she will give in her second lactation on the basis of following information. 1st lactation milk yield(X) = 3000 kg 2nd lactation milk yield = Y X = 2200 kg Y = 2500 kg rXY = 0.80 SD (X) = 150 kg SD (Y) = 160 kg


According to direction:")
 Negative correlation– Both the")
Zero correlation")
 According to no. of variables:")
According to proportionate change")


(∑y)/N]")

(∑y)/N]")


 of r :")