Ann Arbor Public Schools Staffing Report 2015-2016 Insights
Explore the 2015-2016 Ann Arbor Public Schools Staffing Report focusing on diversity, teacher hires, resignations, retirements, staff representation, and more. Gain valuable insights into the staff composition and reflectiveness in mirroring student and community diversity.

Download Presentation

Please find below an Image/Link to download the presentation.
The content on the website is provided AS IS for your information and personal use only. It may not be sold, licensed, or shared on other websites without obtaining consent from the author. If you encounter any issues during the download, it is possible that the publisher has removed the file from their server.
You are allowed to download the files provided on this website for personal or commercial use, subject to the condition that they are used lawfully. All files are the property of their respective owners.
The content on the website is provided AS IS for your information and personal use only. It may not be sold, licensed, or shared on other websites without obtaining consent from the author.
E N D
Presentation Transcript
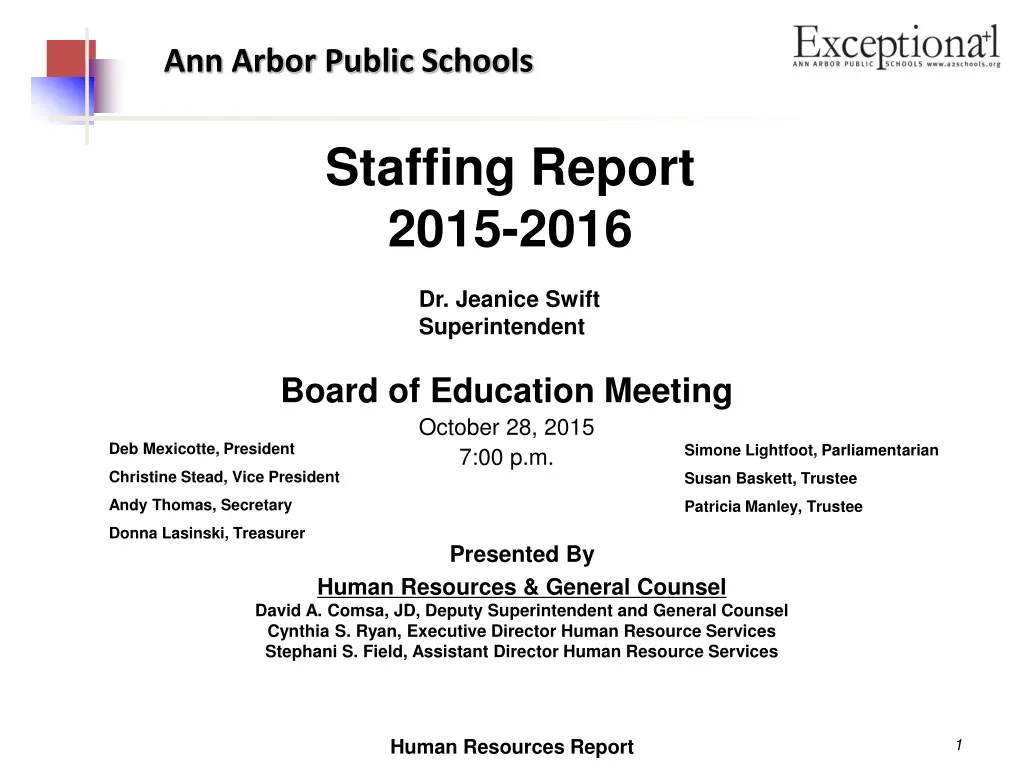
Ann Arbor Public Schools Staffing Report 2015-2016 Dr. Jeanice Swift Superintendent Board of Education Meeting October 28, 2015 7:00 p.m. Christine Stead, Vice President Deb Mexicotte, President Simone Lightfoot, Parliamentarian Susan Baskett, Trustee Andy Thomas, Secretary Patricia Manley, Trustee Donna Lasinski, Treasurer Presented By Human Resources & General Counsel David A. Comsa, JD, Deputy Superintendent and General Counsel Cynthia S. Ryan, Executive Director Human Resource Services Stephani S. Field, Assistant Director Human Resource Services Human Resources Report 1
Diversity CORE Values In the Ann Arbor Public Schools, we: - respect diversity, celebrate and benefit from a rich, diverse learning and work environment, and understand that diversity strengthens the organization. - understand that our students and staff benefit from the many perspectives and rich culture of a diverse educational environment. - know that it is beneficial for students to have diverse and positive role models at school, and across our AAPS organization. - know that students who learn, grow, and succeed in a diverse K-12 environment will be much better prepared to take their next steps in a diverse world. Human Resources Report October 28, 2015 2
Question Driving this Report How well-represented is our AAPS staff in mirroring the diversity of our student and community population? Human Resources Report October 28, 2015 3
Overview Teacher Hires, Resignations, Retirements, and Leaves Students by Race/Ethnicity Professional School Staff by Race/Ethnicity Student and Professional School Staff Comparison - 2015-2016 Other Staff by Race/Ethnicity (Includes Para Educators, Office Professionals, Coordinators and Tech Support Personnel) Building Principals by Race/Ethnicity Building Leaders by Race/Ethnicity Central Administrative Staff by Race/Ethnicity Student and All School Staff Comparison - 2015-2016 Student and All School Staff Pie Chart Comparison - 2015-2016 Student and Professional Staff by Race/Ethnicity 2015-16 Human Resources Report October 28, 2015 4
2015-2016 Staff Totals By Group Professional School Staff (includes Teachers, Counselors, School Social Workers, Speech Therapists, Occupational Therapists, School Psychologists, School Nurses) Para Educators & Other School Support Staff (includes Paraprofessionals, Office Professionals, Coordinators & Technical Support Personnel) Building Principals (also included in Building Leadership) 1,256 533 32 Building Leadership (includes Principals, Assistant Principals, Class Principals & Athletic Directors) Central Office Administration (includes Cabinet, Directors, Assistant Directors, Coordinators, Communications, SISS Assistant Directors & Supervisors) TOTAL* 48 29 1,866 *Staffing numbers are fluid and can change daily Human Resources Report October 28, 2015 5
Teacher Hires, Resignations, Retirements, and Leaves Total Hires Resignation Replacement Hires Retirement Replacement Hires Leave Additional Hires Replacement Hires 2014-2015 123 34 43 8 38 2015-2016 99 21 37 11 30 * *The 2015-2016 data reflects an increase to A2 STEAM with the add of 7th grade; Project Lead the Way at 6 elementary buildings and the secondary level; International Baccalaureate Program Facilitators; preserve class sizes and program needs to support growing enrollment. Human Resources Report October 28, 2015 6
2012-2013 through 2015-2016 Student by Race/Ethnicity Students Percentage 2015-2016 N = 16,903 100% 90% 80% 70% 2012-2013 60% 2013-2014 50.2% 50% 2014-2015 40% 2015-2016 30% 20% 13.9% 14.4% 13.4% 10% 4.4% 0.8% 2.6% 0.3% 0% Human Resources Report October 28, 2015 7
2012-2013 through 2015-2016 Professional School Staff by Race/Ethnicity Professional School Staff (Teachers, Counselors, School Social Workers and Professional School Staff) Percentage 2015-2016 N = 1,256 100% 90% 81.5% 80% 2012-2013 70% 2013-2014 60% 50% 2014-2015 40% 2015-2016 30% 20% 12.2% 10% 2.3% 2.1% 1.3% 0.6% 0% Due to the nature of Federal reporting on employees, staff is not surveyed for Arab American and Multi Ethnic groups. Arab American and Multi Ethnic employees are reported under Caucasian. Employee information is self-reported and the District can only report what is reported by employees Human Resources Report October 28, 2015 8
2012-2013 thru 2015-2106 Para Educators & Other School Support Staff by Race/Ethnicity Para Educators & Other School Support Staff (Para Educators, Office Professionals, Coordinators & Technical Support Personnel) 2015-2016 N = 533 Percentage 100% 90% 80% 70% 2012-2013 66.6% 60% 2013-2014 50% 2014-2015 40% 2015-2016 30% 26.5% 20% 10% 1.3% 1.7% 1.3% 2.6% 0% Due to the nature of Federal reporting on employees, staff is not surveyed for Arab American and Multi Ethnic groups. Arab American and Multi Ethnic employees are reported under Caucasian. Employee information is self-reported and the District can only report what is reported by employees Human Resources Report October 28, 2015 9
2012-2013 through 2015-2016 Building Principals by Race/Ethnicity Building Principals 2015-2016 N = 32 Percentage 100% 90% 80% 68.8% 70% 2012-2013 60% 2013-2014 50% 2014-2015 40% 2015-2016 28.1% 30% 20% 10% 3.1% 0.0% 0.0% 0.0% 0% Due to the nature of Federal reporting on employees, staff is not surveyed for Arab American and Multi Ethnic groups. Arab American and Multi Ethnic employees are reported under Caucasian. Employee information is self-reported and the District can only report what is reported by employees Human Resources Report October 28, 2015 10
2012-2013 through 2015-2016 Building Leaders by Race/Ethnicity Building Leadership (Principals, Assistant Principals, Class Principals and Athletic Directors) Percentage 2015-2016 N = 48 100% 90% 80% 70% 2012-2013 64.6% 60% 2013-2014 50% 2014-2015 40% 33.3% 2015-2016 30% 20% 10% 2.1% 0.0% 0.0% 0.0% 0% Due to the nature of Federal reporting on employees, staff is not surveyed for Arab American and Multi Ethnic groups. Arab American and Multi Ethnic employees are reported under Caucasian. Employee information is self-reported and the District can only report what is reported by employees Human Resources Report October 28, 2015 11
2012-2013 through 2015-2016 Central Administrative Staff by Race/Ethnicity Central Office Administration (Cabinet, Directors, Assist Directors, Coordinators, Communications, SISS Assistant Directors & Supervisors) Percentage 2015-2016 N = 29 100% 90% 80% 70% 2012-2013 62.1% 60% 2013-2014 50% 2014-2015 40% 31.1% 2015-2016 30% 20% 10% 3.4% 3.4% 0.0% 0.0% 0% Due to the nature of Federal reporting on employees, staff is not surveyed for Arab American and Multi Ethnic groups. Arab American and Multi Ethnic employees are reported under Caucasian. Employee information is self-reported and the District can only report what is reported by employees Human Resources Report October 28, 2015 12
Human Resources Report October 28, 2015 13
2015-2016 Student and Professional School Staff Comparison by Race/Ethnicity (Professional Staff include Teachers, Counselors, School Social Workers, School Psychologists, Speech & Language Pathologists, Occupational Therapists, Behavior Intervention Specialists) Percentage 100% 90% 81.5% 80% 70% Students N = 16,903 60% 50.2% 50% Professional Staff N = 1,256 N = 1,256 40% 30% 20% 14.4% 13.4% 13.9% 12.2% 10% 4.4% 2.6% 2.1% 2.3% 0.8% 0.3% 0.6% 1.3% 0% *Arab American and Multi Ethnic categories reported on students, not on staff Human Resources Report October 28, 2015 14
2015-2016 Student and All School Staff Comparison by Race/Ethnicity All School Staff Include: Professional Staff, Building Leaders, Para Educators, Office Professionals, Coordinators & Technical Support Personnel Percentage 100% 90% 80% 76.0% 70% Students N=16,903 N = 16,903 60% 50.2% 50% All School Staff N = 1,839 N = 1,869 40% 30% 20% 17.0% 14.4% 13.4% 13.9% 10% 4.4% 0.8% 0.3% 2.6% 2.5% 1.0% 1.5% 2.0% 0% *Arab American and Multi Ethnic categories reported on students only, not staff Human Resources Report October 28, 2015 15
2015-2016 Student and All School Staff Comparison 2015-2016 Student 2015-2016 All School Staff 1.5% 1.0% 2.0% 2.6% Caucasian Caucasian 0.3% 13.4% Asian Asian 0.8% 17.0% African American African American Hispanic 4.4% Hispanic 2.5% 50.2% Other 13.9% Native American 76.0% Other Multi Cultural Arab American Native American 14.4% Total All Staff: 1,839 Total Enrollment: 16,903* *Fall 2015 preliminary head count Due to the nature of Federal reporting on employees, staff is not surveyed for Arab American and Multi Ethnic groups. Arab American and Multi Ethnic employees are reported under Caucasian. Employee information is self-reported and the District can only report what is reported by employees Human Resources Report October 28, 2015 16
2015-2016 Student and Professional Staff African American Representation Percentage 100% 90% 80% 70% 60% 50% African American Representation 40% 33.3% 32.1% 28.1% 26.5% 30% 20% 13.9% 12.2% 10% 0% Student Teacher & Other Prof. Staff Para Building Principals Building Leaders Central Admin Educators & Other School Support Staff Human Resources Report October 28, 2015 17
2015-2016 Student and Professional Staff Asian Representation Percentage 100% 90% 80% 70% 60% Asian Representation 50% 40% 30% 20% 14.4% 10% 2.6% 2.1% 0.0% 0.0% 0.0% 0% Student Teacher & Other Professional Staff Para Building Principals Building Leaders Central Admin Educators & Other School Support Staff Human Resources Report October 28, 2015 18
2015-2016 Student and Professional Staff Caucasian Representation Percentage 100% 90% 81.5% 80% 68.8% 66.6% 70% 64.6% 64.3% 60% 50.2% Caucasian Representation 50% 40% 30% 20% 10% 0% Student Teachers & Other Prof. Staff Para Building Principals Building Leaders Central Admin Educators & Other School Support Staff Human Resources Report October 28, 2015 19
2015-2016 Student and Professional Staff Hispanic Representation Percentage 100% 90% 80% 70% 60% Hispanic Representation 50% 40% 30% 20% 10% 4.4% 3.6% 3.1% 2.3% 2.1% 1.7% 0% Student Teachers & Other Prof. Staff Para Building Principals Building Leaders Central Admin Educators & Other School Support Staff Human Resources Report October 28, 2015 20
Next Steps Continue to monitor our progress (numbers) in ensuring that all race/ethnic areas are well-represented. Continue to attract strong, diverse, candidate pools and hire the very best candidates. Continue to ensure that diverse employees sit on all hiring committees, at all levels of the organization. Consider 'grow your own' types of teacher preparation programs to engage and connect more diverse prospective candidates into the teaching profession. Continue the conversation, in all our settings, about our priority and value for ensuring a diverse AAPS team. Review race/ethnicity staff selection forms to evaluate ability to achieve continuity. Human Resources Report October 28, 2015 21