Explore key insights from the OREA Annual Convention 2018, including client statistics, average salaries, actuarial conditions, and financial overviews. Gain valuable information on active vs. retired clients, funding ratios, assets vs. liabilities, and contributions for FY-2018.
Please find below an Image/Link to download the presentation.
The content on the website is provided AS IS for your information and personal use only. It may not be sold, licensed, or shared on other websites without obtaining consent from the author. If you encounter any issues during the download, it is possible that the publisher has removed the file from their server.
You are allowed to download the files provided on this website for personal or commercial use, subject to the condition that they are used lawfully. All files are the property of their respective owners.
The content on the website is provided AS IS for your information and personal use only. It may not be sold, licensed, or shared on other websites without obtaining consent from the author.
E N D
Presentation Transcript
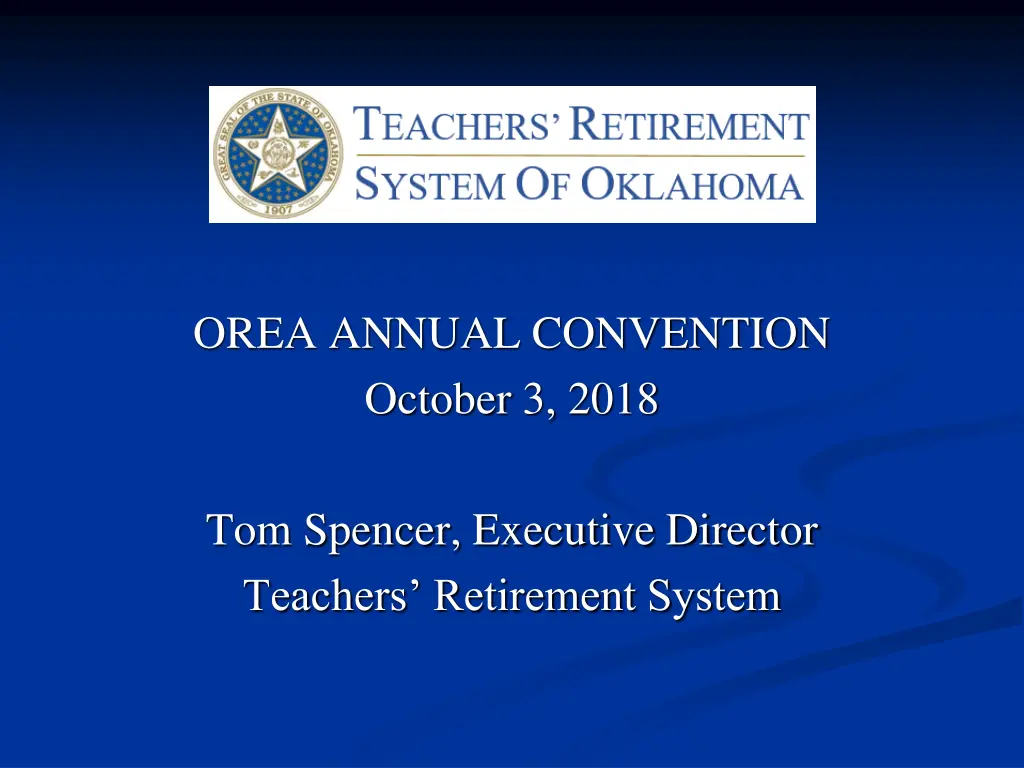
OREA ANNUAL CONVENTION October 3, 2018 Tom Spencer, Executive Director Teachers Retirement System
Client Overview (FY 2017) Average Active Client $46,878 Salary 46.0 Years of Age 11.1 Years of Service Average Retired Client $20,908 Annual Benefit (regular ret ees) $20,443 (reg. & disab. ret ees, benefic. & spouses) 3
Financial Overview Actuarial Condition 2017 Funded Ratio 70.4% on actuarial basis (65.7% in FY 2016) 70.1% on a market value basis (62.2% in FY 2016) Funding Period 17 Years (23 years in FY 2016) *Board lowered investment return assumption from 8.0% to 7.5% for FY 2016 actuarial report 5
Financial Overview FY-2018 Contributions - $1.07 Billion Client Contributions - $312.8 M Employer Contributions - $415.9 M State Contributions (& grants) - $344.6 M FY-2018 Expenditures - $1.4 B Benefit Payments - $1.36 B Refunds - $42.9 M Administrative Expenses - $4.2 M *Ratio of Contrib. to Expenditures 76.2% 7
Financial Overview Investments Positives in Recent TRS Performance (thru 6/30/18 Earned 8.7% for last 10 years (1st percentile) Earned 9.50% for last 5 years (5th percentile) Earned 10.00% for last 12 mos. (9th percentile) Long term returns good from active domestic equity managers and private equity. Very difficult to get returns from fixed income investments as interest rates rise. Source: Oklahoma State Pension Commission, NEPC Consultant 11
Financial Overview Investments SUMMARY System is underfunded but trending higher. Very good returns in last two fiscal years. Funding period is 17 years down from infinity Long-term financial performance is still very good Contributions & Revenue almost equal Actuarially Determined Contributions 12
Legislation 2018 HB 1340 (Rep. McDaniel, et al; Sen. Treat, et al) One-time stipend to members retired as of 10/1/13. Two percent of the gross benefit up to $1,000. Minimum $350 for those with at least 20 years. (Eff. 10/1/18). HB 2553 (Rep. McDaniel; Sen. Pugh) TRS request bill. Section One - Permits the TRS Board to gradually wind down the TRS 403(b) plan. Transition to local plans. Section Two - TRS staff approves disability retirements after Medical Board approval. The TRS Board hears denials. Section Three Eliminates a loophole in ESIP that a few higher education members had. (Eff. 8/2/18). SB 527 (Sen. Stanislawski; Rep. McDaniel) Permits TRS members employed in higher education to purchase up to two years of service credit toward retirement at full actuarial cost, if within two years of retirement. (Eff. 11/1/18) 13
Retirement in America: Out of Reach for Working Americans? Nat l Inst. on Retirement Security Nearly 60% of the 100 million working Americans have no retirement account assets Typical worker with retirement account has a balance of $40,000 68.3% of those between ages 55 to 64 have retirement savings less than their annual income Some states are offering retirement savings plans to their residents. (California, Oregon, Washington & Illinois) (President Trump issued executive order (8/31/18) for U.S. Labor Department to look at relaxing regulations to permit employers to create multi-employer plans to hold down costs) 14


")