Annual Disability Statistics Compendium Overview
The 2016 Annual Disability Statistics Compendium provides a comprehensive compilation of statistics on people with disabilities. It includes data from various sources such as the American Community Survey and Social Security Administration reports. The presentation covers the purpose of the Compendium, new tables and data introduced, as well as key trends and patterns highlighted. Access to the Compendium and technical assistance details are also discussed.

Download Presentation

Please find below an Image/Link to download the presentation.
The content on the website is provided AS IS for your information and personal use only. It may not be sold, licensed, or shared on other websites without obtaining consent from the author. If you encounter any issues during the download, it is possible that the publisher has removed the file from their server.
You are allowed to download the files provided on this website for personal or commercial use, subject to the condition that they are used lawfully. All files are the property of their respective owners.
The content on the website is provided AS IS for your information and personal use only. It may not be sold, licensed, or shared on other websites without obtaining consent from the author.
E N D
Presentation Transcript
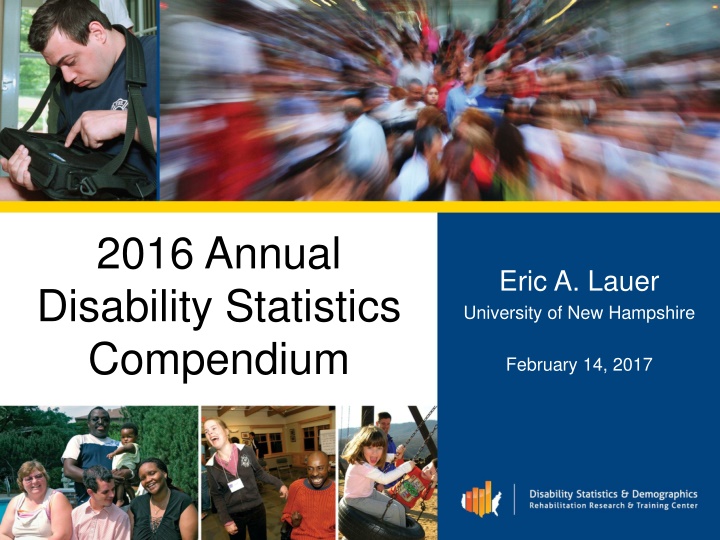
2016 Annual Disability Statistics Compendium Eric A. Lauer University of New Hampshire February 14, 2017
2016 Annual Disability Statistic Compendium Eric A. Lauer University of New Hampshire February 14, 2017 2
Purpose of Todays Presentations Purpose of Today s Presentations Describe the purpose of the Compendium Introduce new tables and data Highlight some of the patterns and trends How to access the Compendium and technical assistance 3
Background Background What is the Compendium? Compilation of statistics on the people with disabilities Why do we care? Disability statistics are often difficult to find and scattered across multiple agencies and websites Compendium Design Comprehensive, accessible, and a guide to what s readily available 4
Data Sources Data Sources American Community Survey (ACS) Current Population Survey (CPS) Basic Monthly Survey Annual Social and Economic Supplement (ASEC) Behavioral Risk Factor Surveillance Survey (BRFSS) Social Security Administration (SSA) reports Office of Special Education Programs (OSEP) sponsored reports Rehabilitation Services Administration (RSA) reports And more 5
Topics Covered Topics Covered Population Size, Prevalence, and Disability Type Demographic Characteristics Health, Health Insurance, Risky Behavior Employment, Earnings, and Poverty Social Security Disability Insurance (SSDI) and Supplemental Security Income (SSI) Medicaid and Medicare Special Education Services and Outcomes And more 6
Whats New This Year? What s New This Year? Substantial Expansion in Volume Approximately 200 new table, with more Required creation of online-only Compendium Supplement Necessitated generating statistics using Public-Use Microdata (PUMS files) to get specific sub-pops Employment Policy section, containing policy variables by state, such as minimum wage 7
Also New This Year? Also New This Year? Transition to Automated Processes Old process: Copy data from original sources and past into Excel Use Excel to do various calculations Paste into a PDF maker New process using an internal web site: Download data and re-format data in SAS Upload data into our web site Create template tables calling in the data Build report (the Compendium) containing the tables Click a button to generate PDF report 8
Future Plans Future Plans State-Specific Compendiums Short Reports Web Application for the Public A TurboTax-like wizard to layout options Users can produce their own tables, charts, and maps and place them into a report of their own design 9
Population Size, 2014 Population Size, 2014 Table 1.3 Civilians (Living in the Community) People with Disabilities 39.9 million (12.6%) People without Disabilities 276.5 million (87.4%) 10 Source: American Community Survey
Since 2008 Since 2008 Civilians, All Ages (Living in the Community) 12.0% 11.9% 12.1% 12.1% 12.6% 12.6% 12.7% 12.2% 39.9 39.9 39.7 38.4 37.5 36.4 36.2 36.1 Millions 276.5 274.9 274.2 274.1 272.3 267.9 265.3 262.5 2008 2009 2010 2011 2012 2013 2014 2015 11 Source: American Community Survey
Share Distribution, by Disability Type, 2015 Share Distribution, by Disability Type, 2015 Tables 1.4-1.9 Civilians Ages 18-64 (Living in the Community) 49.1 52.4 Percentage 36.3 28.1 20.2 18.3 Hearing Vision Cognitive Ambulatory Self-Care Ind. Living 12 Source: American Community Survey
Employment Employment- -Population Ratio, 2015 Population Ratio, 2015 Tables 2.1-2.8 Civilians Ages 18-64 (Living in the Community) 75.4 76.0 51.0 Percentage 40.2 34.9 25.5 24.1 16.4 15.6 No Disability Disability Hearing Vision Cognitive Ambulatory Self-Care Ind. Living 13 Source: American Community Survey
Employment Employment- -Population Ratio, Since 2008 Population Ratio, Since 2008 Civilians Ages 18-64 (Living in the Community) 77.7 74.3 72.8 72.8 76.0 75.4 74.2 73.6 Gap 40.9 pts Gap 41.0 pts Gap 41.1 pts Gap 40.3 pts Gap 40.2 pts Gap 39.0 pts Gap 39.4 pts Gap 38.6 pts Percentage 39.1 35.3 34.9 34.4 33.9 33.4 32.7 32.6 2008 2009 2010 2011 2012 2013 2014 2015 14 Source: American Community Survey
Contact Information Contact Information Institute on Disability University of New Hampshire 10 West Edge Drive, Suite 101 Durham, NH 03824 Eric Lauer (603) 862-4829 Eric.Lauer@unh.edu 15