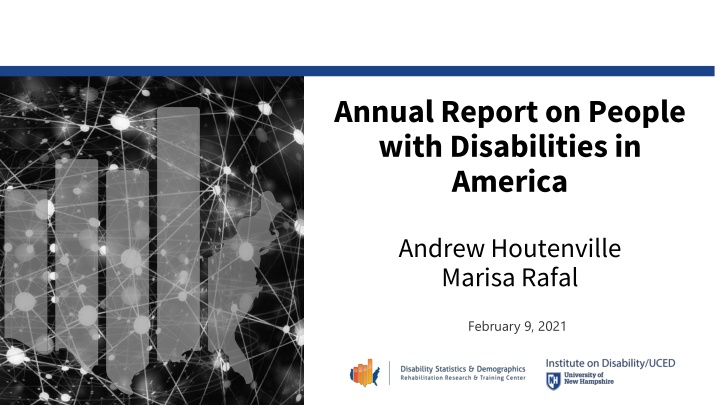
Annual Report on People with Disabilities in America
Year-to-year progress of key indicators for people with disabilities in the U.S. revealed a narrowing of gaps in employment, housing, and an increase in the disablement index. Despite overall stability from 2018 to 2019, there was a noticeable rise in the population with disabilities. The report focuses on the presence of people with disabilities in discussions about social and economic progress, emphasizing the importance of tracking statistical significance to measure meaningful change.

Download Presentation

Please find below an Image/Link to download the presentation.
The content on the website is provided AS IS for your information and personal use only. It may not be sold, licensed, or shared on other websites without obtaining consent from the author.If you encounter any issues during the download, it is possible that the publisher has removed the file from their server.
You are allowed to download the files provided on this website for personal or commercial use, subject to the condition that they are used lawfully. All files are the property of their respective owners.
The content on the website is provided AS IS for your information and personal use only. It may not be sold, licensed, or shared on other websites without obtaining consent from the author.
E N D
Presentation Transcript
Annual Report on People with Disabilities in America Andrew Houtenville Marisa Rafal February 9, 2021
Ensure a presence for people with disabilities in discussions about social and economic progress. Track the year-to-year progress of key indicators relating to the ... Goals of Annual Report Size of the population with disabilities Well-being of people with disabilities Contribution of the environment in the enablement/disablement process.
Did _________ go up or down? Statistical significance Given the available sample, we are able or unable to detect an increase (decrease)? Making the Call Not the same as meaningfulness! Focus on change in gaps change in the differences between people with and without disabilities.
Overall, like 2017-2018, it appears that there was not a great deal of change between 2018- 2019, except Increase in the size of the U.S. population with disabilities, percentage-wise Summary of Results Narrowing of the employment gap A narrowing of the recently constructed housing gap An increase in the disablement index Many gaps did change, when comparing the gap in 2019 to 2008, the first year the data became available
2008 2009 2010 2011 2012 2013 2014 2015 2016 2017 2018 13.1 13.2 2019 Percent with Disabilities Living in Institutions Gap Education: High School Gap Education: College Gap Employment Gap Earnings from Work Gap Specific Results Poverty Gap Health Insurance Gap Private Health Ins. Gap Mass Transit to Work Gap Age of Home/Apartment Gap Disablement Index 40.3 39.8 6.0 5.5 33.6 34.0
2008 12.7 12.6 12.5 12.7 2009 2010 2011 2012 12.7 13.1 13.2 13.1 13.3 13.2 13.1 13.2 2013 2014 2015 2016 2017 2018 2019 Percent with Disabilities Living in Institutions Gap Education: High School Gap Education: College Gap Employment Gap Earnings from Work Gap Specific Results Poverty Gap Health Insurance Gap Private Health Ins. Gap Mass Transit to Work Gap Age of Home/Apartment Gap Disablement Index 40.3 39.8 6.0 5.5 33.6 34.0
2008 12.7 12.6 12.5 12.7 2009 2010 2011 2012 12.7 13.1 13.2 13.1 13.3 13.2 13.1 13.2 2013 2014 2015 2016 2017 2018 2019 Percent with Disabilities Living in Institutions Gap Education: High School Gap Education: College Gap Employment Gap Earnings from Work Gap Specific Results Poverty Gap Health Insurance Gap Private Health Ins. Gap Mass Transit to Work Gap Age of Home/Apartment Gap Disablement Index 38.9 39.4 40.1 40.8 40.4 41.1 41.2 40.8 40.3 40.3 39.8 38.6 6.0 5.5 33.6 34.0
2008 12.7 12.6 12.5 12.7 2009 2010 2011 2012 12.7 13.1 13.2 13.1 13.3 13.2 13.1 13.2 2013 2014 2015 2016 2017 2018 2019 Percent with Disabilities Living in Institutions Gap Education: High School Gap Education: College Gap Employment Gap Earnings from Work Gap Specific Results Poverty Gap Health Insurance Gap Private Health Ins. Gap Mass Transit to Work Gap Age of Home/Apartment Gap 7.9 Disablement Index 38.9 39.4 40.1 40.8 40.4 41.1 41.2 40.8 40.3 40.3 39.8 38.6 7.9 7.7 7.2 6.8 6.3 6.0 5.5 33.6 34.0 7.6 7.6 7.3 7.2
2008 12.7 12.6 12.5 12.7 2009 2010 2011 2012 12.7 13.1 13.2 13.1 13.3 13.2 13.1 13.2 2013 2014 2015 2016 2017 2018 2019 Percent with Disabilities Living in Institutions Gap Education: High School Gap Education: College Gap Employment Gap Earnings from Work Gap Specific Results Poverty Gap Health Insurance Gap Private Health Ins. Gap Mass Transit to Work Gap Age of Home/Apartment Gap 7.9 Disablement Index 38.9 39.4 40.1 40.8 40.4 41.1 41.2 40.8 40.3 40.3 39.8 38.6 7.9 7.7 32.4 32.9 33.4 7.2 6.8 6.3 33.3 33.5 33.1 33.6 34.0 6.0 5.5 7.6 7.6 33.5 32.6 33.2 7.3 7.2 32.2
ARE WE MAKING PROGRESS? ???
2008 12.7 12.6 12.5 12.7 2009 2010 2011 2012 12.7 13.1 13.2 13.1 13.3 13.2 13.1 13.2 2013 2014 2015 2016 2017 2018 2019 Percent with Disabilities Living in Institutions Gap Education: High School Gap Education: College Gap Employment Gap Earnings from Work Gap Specific Results Poverty Gap Health Insurance Gap Private Health Ins. Gap Mass Transit to Work Gap Age of Home/Apartment Gap 7.9 Disablement Index 38.9 39.4 40.1 40.8 40.4 41.1 41.2 40.8 40.3 40.3 39.8 38.6 14.3 13.7 13.9 14.7 14.4 14.0 14.4 14.4 14.3 14.4 14.7 14.5 7.9 7.7 32.4 32.9 33.4 7.2 6.8 6.3 33.3 33.5 33.1 33.6 34.0 6.0 5.5 7.6 7.6 33.5 32.6 33.2 7.3 7.2 32.2
Annual Report is available at www.DisabilityCompendium.org Monthly nTIDE Report at www.ResearchOnDisablity.org Personal Contact Information Andrew J. Houtenville, Ph.D. Professor of Economics and Research Director Institute on Disability University of New Hampshire 10 West Edge Drive, Suite 101 Durham, NH 03824-3593 Email: Andrew.Houtenville@unh.edu Phone: (603) 862-3999 Contact Information
2012 12.7 13.1 13.2 13.1 13.3 13.2 13.1 13.2 2.90 3.02 2.75 2.92 2.86 2.68 2.79 2.89 11.1 11.6 10.1 10.0 9.8 22.6 23.7 22.4 22.6 22.7 38.9 39.4 40.1 40.8 40.4 41.1 7,394 7,181 5,960 5,804 5,672 4,872 5,042 4,824 5,368 5,309 5,901 8,046 14.4 14.3 13.7 13.9 14.7 14.4 -1.6 -3.4 -3.7 -3.7 -3.8 -3.7 -3.3 27.6 28.0 27.9 28.2 29.3 28.5 29.4 30.0 1.2 0.6 0.5 0.9 0.9 0.7 7.9 7.7 7.6 7.6 7.3 32.2 32.4 32.9 33.4 33.5 32.6 33.2 2008 12.7 12.6 12.5 12.7 3.26 3.22 3.00 2009 2010 2011 2013 2014 2015 2016 2017 2018 2019 Percent with Disabilities Living in Institutions Gap Education: High School Gap 10.7 12.0 10.9 Education: College Gap Employment Gap Earnings from Work Gap 2.81 9.0 23.1 10.2 9.2 23.2 9.0 22.8 40.3 39.8 21.5 22.8 38.6 22.6 22.7 Specific Results Poverty Gap Health Insurance Gap Private Health Ins. Gap Mass Transit to Work Gap Age of Home/Apartment Gap 7.9 Disablement Index 41.2 40.8 40.3 14.4 14.0 14.3 14.4 -2.5 30.0 0.5 14.7 -2.6 30.0 0.4 6.0 5.5 14.5 -2.6 29.7 0.2 -3.0 -2.6 30.0 0.5 0.9 0.5 7.2 7.2 6.8 6.3 33.3 33.5 33.1 33.6 34.0
2008 2009 2010 2011 2012 2013 2014 2015 2016 2017 2018 2019 Percent with Disabilities Living in Institutions Gap Education: High School Gap Education: College Gap Employment Gap Earnings from Work Gap Specific Results Poverty Gap Health Insurance Gap Private Health Ins. Gap Mass Transit to Work Gap Age of Home/Apartment Gap Disablement Index