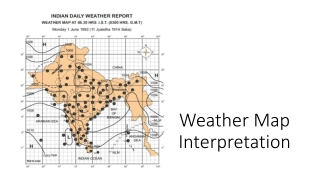
Annual Summary of Weather Systems in the Cayman Islands 2021

This document provides a detailed overview of the weather patterns and rainfall measurements in the Cayman Islands throughout 2021. It covers the dry season months of January to March, transition months of April to June, and the rainy season months of July and August, highlighting rainfall accumulations and deviations from the 30-year average.

Download Presentation

Please find below an Image/Link to download the presentation.
The content on the website is provided AS IS for your information and personal use only. It may not be sold, licensed, or shared on other websites without obtaining consent from the author.If you encounter any issues during the download, it is possible that the publisher has removed the file from their server.
You are allowed to download the files provided on this website for personal or commercial use, subject to the condition that they are used lawfully. All files are the property of their respective owners.
The content on the website is provided AS IS for your information and personal use only. It may not be sold, licensed, or shared on other websites without obtaining consent from the author.
E N D
Presentation Transcript
Travel Nurse Career Survey Results 5-8-2023 Updated with data exported on 5-5-2023
Responses by age group Question 21: Respondent age 350 30.00% 24.22% 300 25.00% 24.69% 250 20.00% 19.86% 200 12.93% 15.00% 150 8.88% 8.33% 10.00% 100 5.00% 1.09% 50 0 0.00% 21-29 30-39 40-49 50-59 60-69 70+ No response Count Percent of total Age group 21-29 30-39 40-49 50-59 60-69 70+ Birth range 2002-1994 1993-1984 1983-1974 1973-1964 1963-1954 1953>
Respondent Gender Question 22: Respondent Gender 1200 90.00% 80.00% 77.02% 1000 70.00% 800 60.00% 50.00% 600 40.00% 400 30.00% 12.15% 20.00% 10.44% 200 10.00% 0.39% 0 0.00% Female Male Prefer Not to Say (blank) Count Percent of total
Marital status Question 23: Marital status 600 45.00% 39.95% 36.76% 40.00% 500 35.00% 400 30.00% 25.00% 300 20.00% 13.01% 200 15.00% 10.28% 10.00% 100 5.00% 0 0.00% Single Married (blank) Divorced Count Percent of total
Children Question 24: Children 450 35.00% 31.07% 400 30.00% 26.48% 24.69% 350 25.00% 300 17.76% 20.00% 250 200 15.00% 150 10.00% 100 5.00% 50 0 0.00% Adult (18+) Children No children School-Aged Children (blank) Count Percent of total
Permanent home region Question 25: "Your permanent home region" 450 35.00% 29.98% 400 30.00% 350 25.00% 300 17.76% 20.00% 250 15.11% 200 15.00% 11.76% 150 10.36% 10.00% 100 5.53% 5.37% 4.13% 5.00% 50 0 0.00% (blank) Northwest East West Southwest Northeast Midwest Southeast Count Percent of total
Currently on assignment? Question 2: "Are you currently on assignment?" 460 56.00% 54.34% 54.00% 440 52.00% 420 50.00% 400 48.00% 45.66% 46.00% 380 44.00% 360 42.00% 340 40.00% No Yes Count Percent of total
Kind of employment sought Question 1: What type of employment are you currently seeking? 900 70.00% 64.64% 800 60.00% 700 50.00% 600 40.00% 500 400 30.00% 300 20.00% 200 13.40% 10.36% 4.67% 10.00% 100 2.10% 3.97% 0.86% 0 0.00% Educational/Teaching Retired Other Leaving Bedside Permanent Position Per Diem Travel Assignment Count Percent of Total
Reason for not seeking travel nurse work Question 2: Why are you no longer seeking employment as a travel nurse? 180 40.00% 34.36% 160 35.00% 140 30.00% 27.31% 120 25.00% 100 18.28% 20.00% 80 13.44% 15.00% 60 6.61% 10.00% 40 5.00% 20 0 0.00% Retiring/Retired Career change Burnout Change of priorities Family obligations Count Percent of total
Return to travel? Question 5: When do you plan on returning to travel nursing? 200 60.00% 180 48.21% 50.00% 160 140 40.00% 120 100 30.00% 20.11% 80 15.98% 20.00% 60 8.82% 6.89% 40 10.00% 20 0 0.00% Within a few weeks I will not be returning to travel nursing Within a few months Within a year Unsure at this time Count Percent of total
Number of agencies worked for in last year Question 7: How many agencies have placed you on an assignment in the past year? (excluding no response) 500 60.00% 54.46% 450 50.00% 400 350 40.00% 33.13% 300 250 30.00% 200 20.00% 12.41% 150 100 10.00% 50 0 0.00% 3+ 2 1 Count Percent of total
Criteria for choosing an agency Question 5: Average stack ranking of criteria for choosing an agency 6.00 5.27 5.00 4.34 4.00 3.51 3.18 2.90 3.00 1.80 2.00 1.00 0.00 Brand Recognition Perks (loyalty bonuses, rewards, recognition gifts, etc.) Ease of Experience Recruiter Relationship Availability of jobs Pay
Criteria for accepting an assignment Question 3: Average stack ranking of influence on assignment acceptance (1 = least important, 5 = most important) 5.00 4.31 4.00 3.67 3.00 2.50 2.46 2.06 2.00 1.00 0.00 Agency Response Time Facility Recruiter Relationship Location Pay
Importance of immediate follow-up? Question 8: "How important is it for you to immediately hear from an agency when seeking an assignment?" 600 80.00% 70.00% 67.11% 500 60.00% 400 50.00% 300 40.00% 26.87% 30.00% 200 20.00% 100 10.00% 3.49% 2.17% 0.36% 0 0.00% Not important Somewhat important Neutral Important Very important Count Percent of total
Preferred method of communication Question 9: "What is your preferred method of communication with your recruiter?" 600 70.00% 63.25% 60.00% 500 50.00% 400 40.00% 300 30.00% 23.25% 200 20.00% 13.49% 100 10.00% 0 0.00% Email Phone Text Count Percent of total
Preferred communication (age group) Question 9: "What is your prefered method of communication with your recruiter?" (by age group) 180 80.00% 160 70.83% 70.00% 69.55% 66.86% 66.67% 140 60.00% 56.16% 120 53.13% 50.00% 100 40.00% 80 33.33% 30.00% 28.13% 60 26.11% 20.91% 20.00% 20.12% 19.44% 18.75% 40 17.73% 13.02% 10.00% 9.72% 9.55% 20 0 0.00% Email Phone Text Email Phone Text Email Phone Text Email Phone Text Email Phone Text Phone Text 21-29 30-39 40-49 50-59 60-69 70+ Count Percent of age group total
Interested in joining TNAC? Question 11: "Would you be interested in joining MedPro Healthcare Staffing's TNAC?" 700 60.00% 600 50.00% 49.69% 500 40.00% 30.84% 400 30.00% 19.47% 300 20.00% 200 10.00% 100 0 0.00% Maybe No Yes Count Percent of total


")