Appalachian Compact LLRW Disposal Data 2016: Volume and Activity Overview
Explore the data on low-level radioactive waste disposal in the Appalachian Compact region for the year 2016 through detailed charts and figures. Discover the disposed LLRW volumes by state and facility types, as well as the corresponding activities in curies. Gain insights into the trends from 1996 to 2016 and understand the distribution across various states and sectors.

Download Presentation

Please find below an Image/Link to download the presentation.
The content on the website is provided AS IS for your information and personal use only. It may not be sold, licensed, or shared on other websites without obtaining consent from the author. If you encounter any issues during the download, it is possible that the publisher has removed the file from their server.
You are allowed to download the files provided on this website for personal or commercial use, subject to the condition that they are used lawfully. All files are the property of their respective owners.
The content on the website is provided AS IS for your information and personal use only. It may not be sold, licensed, or shared on other websites without obtaining consent from the author.
E N D
Presentation Transcript
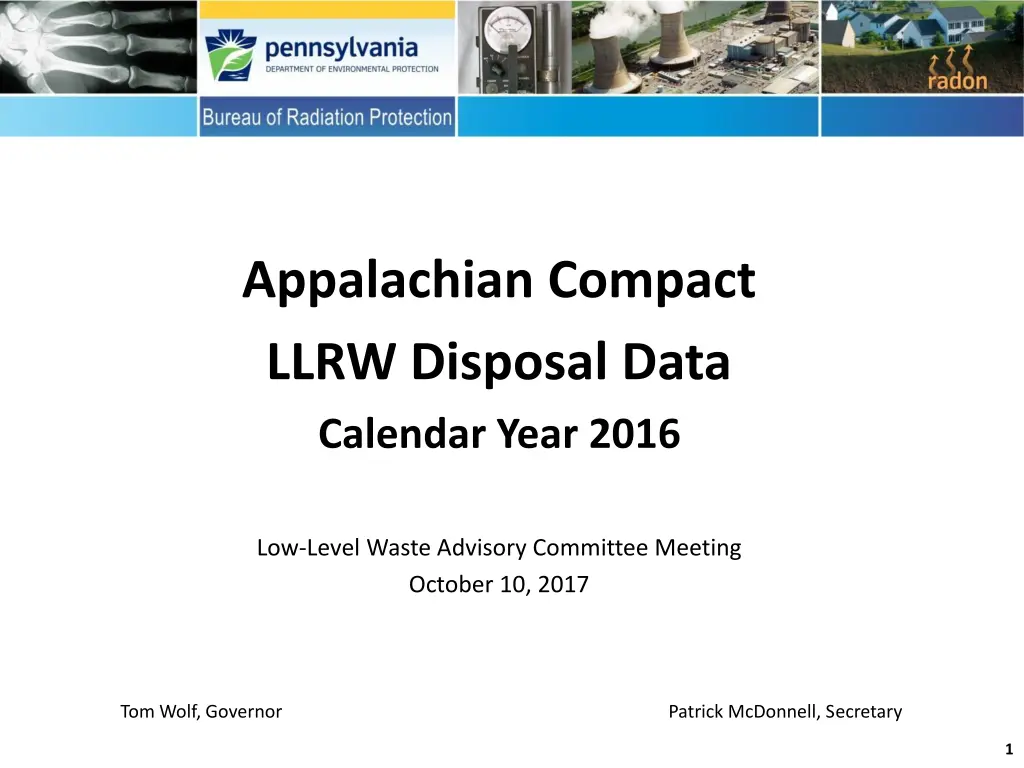
Appalachian Compact LLRW Disposal Data Calendar Year 2016 Low-Level Waste Advisory Committee Meeting October 10, 2017 Tom Wolf, Governor Patrick McDonnell, Secretary 1
Appalachian Compact Disposed LLRW Volume by State and Facility Type - 2016 WV WV DE DE MD MD PA PA Total Total Facility Type/State Facility Type/State 1.8 3.0 18 37 59 Academic Academic 0 0 379 135,000 135,379 Government Government 0 0 283 43,284 43,567 Industry Industry 0 1.5 42 19 62 Medical Medical 0 0 6,629 59,353 65,982 Utility Utility 1.8 4.5 7,351 237,692 245,049 Total Total Volume is in cubic feet. This data is for LLRW disposal at EnergySolutions in Clive, Utah, and Waste Control Specialists in Andrews, Texas, for the calendar year 2016. 2
Appalachian Compact Disposed LLRW Volume by State and Facility Type - 2016 250,000.0 200,000.0 Volume Cubic Feet 150,000.0 100,000.0 Total PA 50,000.0 MD DE WV 0.0 Academic Government Industry Medical Utility Total 3
Appalachian Compact Disposed LLRW Activity by State and Facility Type - 2016 WV WV DE DE MD MD PA PA Total Total Facility Type/State Facility Type/State 0.35 0.013 0.038 0.002 0.40 Academic Academic 0 0 0.034 0.056 0.090 Government Government 0 0 6.88 31.80 38.67 Industry Industry 0 0.00017 0.051 0.042 0.093 Medical Medical 0 0 202.00 1989.03 2,191.03 Utility Utility 0.35 0.014 209.00 2,020.92 2,230.29 Total Total Activity is in curies. This data is for LLRW disposal at EnergySolutions in Clive, Utah, and Waste Control Specialists in Andrews, Texas, for the calendar year 2016. 4
Appalachian Compact Disposed LLRW Activity by State and Facility Type - 2016 2,500 2,000 Activity Curies 1,500 1,000 Total PA MD 500 DE WV 0 Academic Government Industry Medical Utility Total WV DE MD PA Total 5
Appalachian Compact Disposed LLRW Volume in Cubic Feet from 1996 to 2016 Year 1996 1997 1998 1999 2000 2001 2002 2003 2004 2005 2006 2007 2008 2009 * 2010 * 2011 * 2012 * 2013 * 2014* * 2015* * 2016* * WV DE MD PA Total 34.8 1.8 48.0 158.7 53.4 44.1 183.3 151.8 34.8 2.4 38.0 48.7 132.2 134.1 11.3 19.1 21.0 44.8 24.8 19.0 1.8 127.2 23.9 173.8 80.6 27.6 76.2 366.4 73.5 48.8 74.2 59.2 42.7 414.8 431.2 29.4 1,061.0 75.2 339.5 42.7 45.2 3,391.1 3,096.5 7,604.6 8,406.8 9,766.8 10,759.9 6,752.8 3,703.1 13,177.8 107,956.4 48,131.8 21,015.6 6,702.5 21,451.3 22,957.6 10,568.7 12,364.3 23,597.2 72,334.3 18,202.9 7,351.0 439,293.0 24,203.1 14,486.2 42,686.0 143,043.7 421,398.1 534,429.4 55,371.4 74,901.0 55,136.0 91,292.6 57,627.7 78,454.5 113,483.2 103,666.9 76,519.4 155,508.5 122,380.2 72,066.9 56,040.4 91,222.9 237,692.0 2,621,610.1 27,756.2 17,608.4 50,512.4 151,689.8 431,245.9 545,309.6 62,673.9 78,829.4 68,397.4 199,325.6 105,856.7 99,561.5 120,732.7 125,683.5 99,517.7 167,157.3 134,840.7 96,048.4 128,442.2 109,490.0 245,049.0 4.5 1,207.9 3,617.6 Grand Total 3,065,728.30 Total * 2009 to 2013 LLRW volume only includes disposal at EnergySolutions in Clive, Utah. ** 2014 to 2016 includes disposal at EnergySolutions in Clive, Utah, and Waste Control Specialists in Andrews, Texas. Years 1996 to 2008 include disposal at Barnwell, South Carolina, and Energy Solutions, Clive, Utah. 6
Appalachian Compact Disposed LLRW Volume in Cubic Feet from 1996 to 2016 550,000 500,000 450,000 400,000 350,000 Cubic Feet 300,000 250,000 Total 200,000 PA 150,000 MD 100,000 DE 50,000 WV 0 Year 7
Appalachian Compact Disposed LLRW Activity in Curies from 1996 to 2016 Year 1996 1997 1998 1999 2000 2001 2002 2003 2004 2005 2006 2007 2008 2009 * 2010 * 2011 * 2012 * 2013 * 2014 ** 2015 ** 2016** WV DE MD PA Total 0.1 0.03 37.3 0.5 2.2 0.03 0.1 0.2 0.8 0.7 0.03 0.2 0.1 0.02 0.01 0.02 0.003 0.01 0.002 0.02 0.35 5.6 1.3 0.1 0.1 0.02 0.03 0.5 24.7 0.2 31.3 11.9 12.9 12.2 0.5 0.03 1.0 0.01 45.3 0.01 0.007 0.014 349.1 198.5 531.5 1,335.7 484.0 903.3 244.5 166.3 11,830.7 156.8 60.1 25,304.7 2,181.5 71,900.5 8,017.9 43,691.0 86,618.0 357,624.4 168,919.6 6,777.4 241,649.8 18,890.3 58,786.2 91,719.1 492,579.3 283,328.8 1,001.4 656.8 492.6 449.3 458.5 1,212.8 4,147.3 2,020.93 72,255.4 8,217.7 44,259.9 87,954.3 358,110.7 169,822.9 7,022.5 241,840.9 30,722.0 58,974.9 91,791.1 517,897.0 285,522.6 1,006.6 658.2 495.5 451.4 519.5 1,473.5 4,175.2 2,230.29 4.7 1.4 1.8 2.1 15.7 260.7 27.8 209 Total 42.725 147.72 44,269.9 1,940,941.93 Grand Total 1,985,402.09 * 2009 to 2013 LLRW activity only includes disposal at EnergySolutions in Clive, Utah. ** 2014 to 2016 includes disposal at EnergySolutions in Clive, Utah, and Waste Control Specialists in Andrews, Texas. Years 1996 to 2008 include disposal at Barnwell, South Carolina, and EnergySolutions, Clive, Utah. 8
Appalachian Compact Disposed LLRW Activity in Curies from 1996 to 2016 600,000 500,000 400,000 Curies 300,000 Total 200,000 PA MD 100,000 DE WV 0 Year 9
Appalachian Compact Disposed LLRW Activity in Curies from 2009 to 2016 4,500 4,000 3,500 3,000 2,500 Total Curies 2,000 PA 1,500 MD 1,000 DE 500 WV 0 Year 10
Appalachian Compact Percent Disposed LLRW Volume by Disposal Site - 2016 513 cubic feet, 0.21% 244,536 cubic feet, 99.79% EnergySolutions EnergySolutions WCS 11
Appalachian Compact Percent Disposed LLRW Activity by Disposal Site - 2016 989 Curies, 44% 1,242 Curies, 56% Energy Solutions EnergySolutions WCS 12
Thank you. Questions? Rich Janati Chief, Division of Nuclear Safety Administrator, Appalachian Compact Comm. Phone: 717-787-2163 rjanati@pa.gov 13