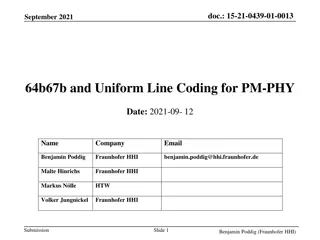
Architecture-Centric Derivation of Products in a Software Product Line
This study explores the integration of architecture-centric development with product line development, focusing on customizing product line architecture for software extensibility and reusability. Strategies, challenges, and implementation approaches are discussed.

Download Presentation

Please find below an Image/Link to download the presentation.
The content on the website is provided AS IS for your information and personal use only. It may not be sold, licensed, or shared on other websites without obtaining consent from the author.If you encounter any issues during the download, it is possible that the publisher has removed the file from their server.
You are allowed to download the files provided on this website for personal or commercial use, subject to the condition that they are used lawfully. All files are the property of their respective owners.
The content on the website is provided AS IS for your information and personal use only. It may not be sold, licensed, or shared on other websites without obtaining consent from the author.
E N D
Presentation Transcript
STANDARD COSTING & VARIANCE ANALYSIS 1
DEFINITION Standard costs are target costs for each operation that can be built up to produce a product standard cost. A budget relates to the cost for the total activity,whereas standard relates to a cost per unit of activity. 2
Standard Costs Based on carefully predetermined amounts. Used for planning labor and material requirements. Standard Costs are The expected level of performance. Benchmarks for measuring performance. 3
An overview of a standard costing system 4
Purposes of standard costing 1. To provide a prediction of future costs that can be used for decision-making. 2. To provide a challenging target that individuals are motivated to achieve. 3. To assist in setting budgets and evaluating performance. 4. To act as a control device by highlighting those activities that do not conform to plan. 5. To simplify the task of tracing costs to products for inventory valuation. 5
Setting Standards Analysis of Historical Data What DID the product cost? Used in a mature production Process What Analyze the process of manufacturing the product Task Analysis SHOULD the product cost? A Analyze the process for the step that has changed, but use historical data for the steps that have not changed Combined Approach 6
Participation in Setting Standards Accountants, engineers, personnel administrators, and production managers combine efforts to set standards based on experience and expectations. 7
Types of Standard Cost Basic cost standards Represents constant standards that are left unchanged over long periods. Ideal standards Represent perfect performance, the minimum costs that are possible under the most efficient operating conditions Currently attainable standards Those costs that should be incurred under efficient operating conditions 8
Perfection Vs. Practical Standards PRACTICAL OR ATTAINABLE STANDARDS PERFECTION STANDARDS Can only be attained under near perfect conditions Tight as practical, but still are expected to be attained Peak efficiency Lowest possible input prices best-quality material no disruption in production Occasional machine breakdowns Normal amounts of raw material waste 9
Perfection versus Practical Standards: A Behavioral Issue Practical standards should be set at levels that are currently attainable with reasonable and efficient effort. Should we use practical standards or perfection standards? 10
Perfection versus Practical Standards: A Behavioral Issue I agree. Perfection standards are unattainable and therefore discouraging to most employees. 11
Use of Standards by Nonmanufacturing Organizations Standard cost analysis may be used in any organization with repetitive tasks. A relationship between tasks and output measures must be established. 12
Variance Analysis Cycle Take Identify questions. Receive explanations. corrective actions. Conduct next period s operations. Analyze variances. Prepare standard cost performance report. Begin 13
Material Variance Analysis Standard Cost Variances Price Variance Quantity Variance The difference between the actual price and the standard price The difference between the actual quantity and the standard quantity 14
Material Variance Actual Quantity Actual Quantity Standard Quantity Actual Price Standard Price Standard Price Price Variance Quantity Variance Standard price is the amount that should have been paid for the resources acquired. 15
Material Variance Actual Quantity Actual Quantity Standard Quantity Actual Price Standard Price Standard Price Price Variance Quantity Variance Standard quantity is the quantity allowed for the actual good output. 16
Material Variance Actual Quantity Actual Price Standard Price Standard Price Actual Quantity Standard Quantity Price Variance Quantity Variance AQ(AP - SP) SP(AQ - SQ) Materials price variance Materials quantity variance Labor rate variance Labor efficiency variance Variable overhead Variable overhead spending variance efficiency variance AP = Actual Price SQ = Standard Quantity AQ = Actual Quantity SP = Standard Price 17
Standard Costs Let s use the concepts of the general model to calculate standard cost variances, starting with direct material. Refer to Example 3.1 18
Responsibility for Material Variances You used too much material because of poorly trained workers and poorly maintained equipment. Also, your poor scheduling sometimes requires me to rush order material at a higher price, causing unfavorable price variances. I am not responsible for this unfavorable material quantity variance. You purchased cheap material, so my people had to use more of it. 19
Labor Variance Analysis Standard Cost Variances Rate Variance Efficiency Variance The difference between the actual rate and the standard rate The difference between the actual hour and the standard hour 20
Labor Variance Actual Hour Actual Hour Actual Rate Standard Rate Standard Rate Standard Hour Rate Variance Efficiency Variance Standard rate is the amount that should have been paid for the resources acquired. 21
Labor Variance Actual Hour Actual Hour Actual Rate Standard Rate Standard Rate Standard Hour Rate Variance Efficiency Variance Standard hour is the hour allowed for the actual good output. 22
Labor Variance Actual Hour Actual Hour Actual Rate Standard Rate Standard Rate Standard Hour Rate Variance Efficiency Variance AH(AR - SR) SR(AH - SH) AH = Actual Hour AR = Actual Rate SH = Standard Hour SR = Standard Rate 23
Standard Costs Now let s calculate standard cost variances for direct labor. Refer to Example 3.1 24
Labor Rate Variance A Closer Look Using highly paid skilled workers to perform unskilled tasks results in an unfavorable rate variance. High skill, high rate Low skill, low rate Production managers who make work assignments are generally responsible for rate variances. 25
Labor Efficiency Variance A Closer Look Poorly trained workers Poor quality materials Unfavorable Efficiency Variance Poor Poorly maintained equipment supervision of workers 26
Responsibility for Labor Variances I am not responsible for the unfavorable labor efficiency variance! You purchased cheap material, so it took more time to process it. You used too much time because of poorly trained workers and poor supervision. 27
Responsibility for Labor Variances Maybe I can attribute the labor and material variances to personnel for hiring the wrong people and training them poorly. 28
Overhead Variances Let s turn our attention to the computation of overhead variances. We will begin with variable overhead. 29
Variable Overhead Variances Actual Flexible Budget Flexible Budget Variable for Variable Overhead Overhead at Overhead at Incurred Actual Hours Standard Hours for Variable AH AR AH SVR SH SVR Spending Variance AH = Actual Hours of Activity AR = Actual Variable Overhead Rate SVR = Standard Variable Overhead Rate SH = Standard Hours Allowed Efficiency Variance 30
Variable Overhead Variances Actual Flexible Budget Flexible Budget Variable for Variable Overhead Overhead at Overhead at Incurred Actual Hours Standard Hours for Variable AH AR AH SVR SH SVR Spending Variance Efficiency Variance Spending variance = AH(AR - SVR) Efficiency variance = SVR(AH - SH) 31
Fixed Overhead Variances Actual Budgeted Fixed Fixed Overhead Overhead Incurred Budget Variance 32
Standard Costs Now let s calculate standard cost variances for Overhead. Refer to Example 3.1 33
Variable Overhead Variances A Closer Look Spending Variance Efficiency Variance A function of the selected cost driver. Results from paying more or less than expected for overhead items and from excessive usage of overhead items. It does not reflect overhead control. 34
Sales Variance Standard Margin at Actual Volume Budgeted Margin Actual Margin AM AV AV SM SM BV Sales Price Variance = Actual contribution margin = Standard contribution margin = Actual Volume = Standard Volume Sales Volume Variance AM SM AV BV 35
Sales Variance Standard Margin at Actual Volume Budgeted Margin Actual Margin AM AV AV SM SM BV Sales Price Variance Sales Volume Variance Price variance = AV(AM - SM) Volume variance = SM(AV - BV) 36
Standard Costs Now let s calculate variances for Sales. Refer to Example 3.1 37
Reconciling Now reconcile budgeted profit with and actual profit. 38
(RM) RM) RM) 80,000 Budgeted net profit Sales Variance: Sales margin price Sales margin volume Material price variance Material usage variance Labor rate variance Labor efficiency variance Variable overhead expenditure Variable overhead efficiency Fixed overhead expenditure Actual profit 18,000F 20,000A 8,900 A 26,500 A 17,100A 13,500A 5,000F 3,000A 4,000F 2,000A 35,400A 30,600A 6,000F 62,000A 18,000 39
Summary of the meaning of variance Refer to Exhibit 3.1 40
Absorption costing Variance Fixed overhead volume variance. (AP BP) x SFR Volume efficiency variance (SH AH) x SFR Volume capacity variance (AH BH) x SFR Sales margin volume variance (AV SV) x SPM 41
Planning & Operating Variances Most of the problems with standard costing variance analysis are to do with the comparison of actual performance with the standard. Demski (1977) argued that if the environment is different from that anticipated, actual performance should be compared with a standard which reflects these changed conditions. To measure managerial performance, we should compare like with like and compare actual results with adjusted standards based on the condition that managers actually operated during the period. 42
Planning & Operating Variances for material Material price planning variance (SP RSP) x AQ or (SP RSP) x RSQ Material price operating variance (RSP AP) x AQ Material usage planning variance (SQ RSQ) x SP Material usage operating variance (RSQ AQ) x SP or ((RSQ AQ) x RSP 43
Planning & Operating Variances for material Example The standard quantity of materials per unit of production is 5 kg. The standard cost per kg of material was estimated to be RM 1.Actual production for the period was 250 units and actual material usage was 1,450 kg. The general market price at the time of purchase was RM 1.20 per kg and the actual price paid was RM 1.18 per kg. Because of shortage of skilled labor, it has been necessary to use unskilled labor and it is estimated that this will increase the material usage by 20% 44
Planning & Operational Variances Material price planning variance (1 1.20) x 1,450 = 290 A Material price operating variance (1.18 1.20) x 1,450 = 29 F Material usage planning variance (1,250 1,500) x 1 = 250 A Material usage operating variance (1,450 1,500) x 1 = 50 F 45
Planning & Operational Variances Refer to Example 3.2 46
Materials Mix & Yield Variances In many industries, particularly of the process type, it is possible to vary the mix of input materials and affect the yield. Where it is possible two or more raw materials, input standards should be established to indicate the target mix of materials required to produce a unit, or a specified number of units, of output. 47
Materials Mix Variances Mix Variance arise when the mix of material used differs from the predetermined mix included in the calculation of the standard cost of an operation. The formula for the material mix variance is as follows; (actual quantity in standard mix proportion actual quantity used) x standard price 48
Materials Mix Variances Example The Milano company has established the following standard mix for producing 9 litres of product A RM 35 15 5 litres of material X at RM 7 per litre 3 litres of material Y at RM 5 per litre 2 litres of material Z at RM 2 per litre 4 54 49
Materials Mix Variances A standard loss of 10% of input is expected to occur. Actual input RM 53,000 litres of material X at RM 7.00 per litre 28,000 litres of material Y at RM 5.30 per litre 19,000 litres of material Z at RM 2.20 per litre 100,000 371,000 148,400 41,800 561,200 Actual output for the period was 92,700 litres of product A 50


")