Are Our Young People Out of Control? Exploring Juvenile Offending Trends
Juvenile offending is a complex issue with societal implications. While public perceptions often portray a rise in youth violence, objective data on trends remain uncertain. This lack of clarity raises questions about policy responses and resource allocation. Understanding the true nature of juvenile offending is crucial for effective interventions and targeted strategies.
Download Presentation

Please find below an Image/Link to download the presentation.
The content on the website is provided AS IS for your information and personal use only. It may not be sold, licensed, or shared on other websites without obtaining consent from the author.If you encounter any issues during the download, it is possible that the publisher has removed the file from their server.
You are allowed to download the files provided on this website for personal or commercial use, subject to the condition that they are used lawfully. All files are the property of their respective owners.
The content on the website is provided AS IS for your information and personal use only. It may not be sold, licensed, or shared on other websites without obtaining consent from the author.
E N D
Presentation Transcript
Are our young people out of control and do we even know? Paul Mazerolle, Samara McPhredran, Christine Bond Griffith University
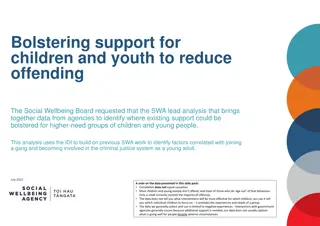
Background Juvenile offending long recognised as a significant social, health, and justice concern. 1990s onwards expansion of evidence base. Knowledge about modifiable influences on juvenile offending now spans biological, demographic, cultural, situational/environmental, and socioeconomic spheres. Particular focus has been given to better understanding the wide range of risk and protective factors associated with the onset, characteristics, and persistence of juvenile offending. Knowledge about pathways to and from offending, and trajectories of offending, has grown substantially.
Public/media perceptions Concern about juvenile offending especially when it involves violence and the consequences for individuals, families, and communities. Concern about the nature of the problem its scale and scope and appropriate responses. High-profile incidents (e.g., one punch kills ) gain intense attention and drive calls for change . Emotive, sensationalised media coverage creates an impression of crisis. Perceptions of increased juvenile offending, with violence a key focus.
Political/policy context Steady flow of political discourse around juvenile offending and youth violence in particular. System has gone soft Tough new laws Commonsense approach . Range of policy interventions, typically underpinned by legislation. Legislative changes introduced concerning the range of sentencing options that can be applied to young offenders (e.g., QLD boot camps )
Reality, or moral panic? Despite providing impetus for legislative/policy change, it is unclear whether perceptions of an upwards trend in Australian juvenile offending (offending by persons aged 10- 17 years inclusive) are supported by objective data. Many studies into specific aspects of offending and specific samples, but a relative absence of epidemiological research. Without epidemiological information, responses to juvenile offending may not be proportional to the magnitude of actual problems, and/or may be inappropriately designed and targeted. Raises the possibility of resource misdirection and policy failure.
Unanswered questions Is juvenile offending or delinquency increasing? Is violent offending, in particular, on the rise? Have overall offending rates changed? If there are observed changes over time in juvenile offending, are these real changes, or are they attributable to changing crime data recording practices, and/or police responses? Do overall trends disguise changes in particular sub-types of offending within a specific offence type? Can we say anything meaningful about the prevalence of offending, at the general population level?
The present study Using multiple data sources, the present study seeks to assess, from an epidemiological perspective, whether there is convincing evidence for changing (upwards) trends in Australian juvenile/youth offending. Particular emphasis is given to violent offending, as this form of offending typically attracts significant concern and drives policy change.
Initial cautions about data Official (administrative) statistics Police records (whether released by police, or provided for use by other agencies e.g., ABS), Childrens Courts Data availability, detail, and frequency of collation/release varies greatly over time, both within and across jurisdictions, as well as at the national level. Unit of measurement/counting rules for some datasets make comparability difficult offences or offenders ? Self-report datasets on offending prevalence/frequency very few available! Typically small-scale and one-off .
Historic trends - overview Throughout the 1980s and 1990s, official statistics were used in a range of Australian studies and suggested increasing violent delinquent behaviour in particular. E.g., in Victoria, in 1986-1987, 4.9% of all juvenile arrests were for violence. This rose to 8.9% in 1995- 1996. In Queensland, at the same time periods, violent offending accounted for 4.7% and 9.3% of juvenile arrests (Mukherjee, 1997). Similar observations across jurisdictions for the early to mid 2000s, using Australian Bureau of Statistics data.
Historic trends Juvenile offenders from 1996 97 to 2006 07, by sex (per 100,000 juveniles of that sex per year) From: Australian Institute of Criminology (2009), Australian Crime: Facts and Figures 2008.
Historic trends Juvenile offenders in 1996 97 and 2006 07, by offence type (per 100,000 juveniles per year) From: Australian Institute of Criminology (2009), Australian Crime: Facts and Figures 2008.
Historic trends Violent offences as a proportion of total offences (NSW) Males Females 35 35 Relative proportion (%) of violent:total offences Relative proportion (%) of violent:total offences 30 30 25 25 20 20 15 15 10 10 5 5 0 0 1996/1997 1998/1999 2000/2001 2002/2003 2004/2005 1996/1997 1998/1999 2000/2001 2002/2003 2004/2005 year period year period 15-19 year olds 10-14 year olds
Historic trends Violent offences as a proportion of total offences (VIC) Females Males 24 30 Relative proportion (%) of violent:total offences Relative proportion (%) of violent:total offences 20 25 16 20 12 15 8 10 4 5 0 0 1996/1997 1998/1999 2000/2001 2002/2003 2004/2005 1996/1997 1998/1999 2000/2001 2002/2003 2004/2005 year period year period 15-19 year olds 10-14 year olds
Historic trends Violent offences as a proportion of total offences (QLD) Females Males 14 18 Relative proportion (%) of violent:total offences Relative proportion (%) of violent:total offences 12 15 10 12 8 9 6 6 4 3 2 0 0 1996/1997 1998/1999 2000/2001 2002/2003 2004/2005 1996/1997 1998/1999 2000/2001 2002/2003 2004/2005 year period year period 15-19 year olds 10-14 year olds
Historic trends - summary Small decline in overall offender rate among juvenile males from the mid 1990s-mid-2000s Some modest signs of an increase in female juvenile offender rate. Evidence for an increase in the proportion of offences involving violence.
Number of offenders, all offence types Number of youth offenders (10-19 years) 120000 100000 Number of offenders 80000 Male 60000 Female All persons 40000 20000 0 2007-2008 2008-2009 2009-2010 2010-2011 2011-2012 2012-2013 Year Source: ABS
Offender rate, all offence types Year Source: ABS
Offender rate, by single year of age Source: ABS
Violent offender rates, by broad age group Year Source: ABS
Violent offender rate, by single year of age Source: ABS
Childrens Courts data Childrens Courts (Australia) - Matters Adjudicated 2006-07 to 2011-12 8000 Acts intended to cause injury 7000 Theft and related offences Unlawful entry with intent 6000 Property damage and environmental pollution Number of matters 5000 Traffic and vehicle regulatory offences 4000 Public order offences 3000 Dangerous or negligent acts endangering persons 2000 Robbery, extortion and related offences Offences against justice 1000 Illicit drug offences 0 2006 07 2007 08 2008 09 2009 10 2010 11 2011 12 Year Source: ABS
Changes in policing practice? QLD court and police statistics Source: Childrens Court of Queensland Note: Ages include 10 to 17 years
Offence type classification: a hidden story emerging in the details? Offending among 10-17 year olds, NSW, 2009-2013 Trend & average annual percentage change over last 60 months from Jan 2009 to Dec 2013 Not calculable 4.2 -11.8 Stable Stable -13.8 Stable Stable -15.9 -12.5 -16.5 -8.2 -8.1 -2.4 Stable 1.3 -10.1 Offence Murder DV related assault Non DV related assault Sexual assault Indecent assault, act of indecency and other sexual offences Robbery without a weapon Robbery with a firearm Robbery with a weapon not a firearm Break and enter dwelling Break and enter non-dwelling Motor vehicle theft Steal from motor vehicle Steal from retail store Steal from dwelling Steal from person Fraud Malicious damage to property Source: New South Wales Bureau of Crime Statistics and Research
Official statistics - summary Available statistics (piecemeal though they are!), whichever way they are examined, do not tend to support perceptions about steadily increasing youth crime nor about a dramatically increasing proportion of youth offending involving violence. If anything, the national violent offender rate appears to have declined slightly in recent years. There may be important changes occurring in specific sub-types of offending, such as DV- related assault.
Official statistics - summary Changes in (dis)aggregation practices over time make it difficult to draw firm conclusions based on publicly available statistics. Shift towards the use of broad youth age bracket categorisations (10-19 years), rather than providing data by individual year of age makes it difficult (in some cases, impossible) for juvenile offenders to be specifically extracted from data. Juvenile statistics now include 18+ year olds, however what is happening among those ages may differ from what is happening among 10-17 year olds. Disaggregated data for males versus females are no longer provided annually at the national (or jurisdictional) level, for specific offence types.
Official statistics - summary Unable to say whether there is a constant relationship between the number and rate of juvenile offenders in the general population, and the number and rate of juveniles proceeded against for offending the role of policy changes and shifting policing practices? What about repeat offenders relative to earlier years, are a (smaller?) number of youths offending more frequently? Unclear whether there is increasing/more frequent juvenile participation in behaviours at the more serious end of the offending spectrum .
More caveats An illustrative overview - not intended to be an exhaustive summary of all data/studies. Does not take into account general datasets that may also provide future information on issues relating to juvenile offending. E.g., Longitudinal Study of Australian Children initial cohort of children studied are now entering their teens, study contains some questions on drugs, alcohol, bullying/victimisation, frequency of hitting others, weapon carriage.
Scope of behaviours Most studies focus on a relatively narrow range of behaviours (especially underage drinking, and cannabis use). Important information, and can act as a flag for the presence of other types of offending. But - need to know about a wider range of behaviours to get the full picture of youth offending.
Age-crime relationship revisited Some self-report studies adopt a longitudinal approach (e.g., following a cohort of students from year 8, to year 9, to year 10 Houghton & Carroll, 2002). Such studies provide useful insights into types of behaviour juveniles engage in, and confirm that participation levels increase as the teen years progress. However, this does not tell us whether participation by certain age groups (or youth in general) is increasing. The key question is not does a young person participate in offending more at the age of 15 than at the age of 13? (the age-crime relationship). We want to know: does a 15 year old in 2015 participate more in offending behaviour than a 15 year old in 2005? (the are our young people out of control? question).
Self-reported participation Hemphill et al (2012) students: non-violent antisocial behaviour (e.g., theft); 18.7% for males and 20.3% for females in year 9. Hemphill et al (2010) students: 10.8% of males and 3.2% of females aged ~10-15 years had engaged in more than one occasion of violent behaviour in the past 12 months. Houghton & Carroll (2002) students: public disorder offences (e.g., not paying public transport fare or venue entrance fee) the most common among year 8,9, and 10 students, about 20-30% reported violence. Fagan & Western (2003) students and at-risk youths: two-thirds of 12-17 year olds had engaged in at least one form of offending behaviour in the previous 12 months, most commonly theft (44%) which included not paying entrance fees. Offending participation among the student sample was lower and less frequent than in the at-risk sample.
QLD: Sibling Study (1995), ARC Police-Young People Study (2006) 4 cohorts School Vulnerable Offender Indigenous School-based sample 5 state high schools Students enrolled in Year 9 Self-report questionnaire School cohort 16 state high schools Respondents aged between 12 and 18 years Self-report questionnaire Mix-sex sibling pairs (12-18 years) < than 3 years apart Analysis restricted to school cohort (n=679) n=540
Data from year 9 youth in SEQ (1995, 2006) 35.0% 33.3% 32.0% Self reported violence: Have you ever . 30.0% 30.0% 25.0% Been in a fight Beaten someone up Used a weapon Used force or threat of force 22.2% 20.0% 17.2% 15.2% 15.0% 13.8% 10.9% 10.0% 5.0% 0.0% Violent acts Vandalism Theft* Drug use* Sibling Study ARC Police data
Violent behaviour (%) in previous 3 months (Year 9 students, 2006) Wave 1 Wave 2 Deliberately hurt or beat up somebody 21.74 29.91 Used anything as a weapon in a fight 9.57 17.24 Threatened someone or forced someone to give you things 13.04 19.66 Hit a teacher or supervisor 0 4.27 Total (n) 115 116
Self reported frequency of attacking another student in last 12 months Frequency in past 12 months (year 8&9) No. % Never Once Twice 3-4 times 5+ times 1,421 593 212 118 189 56.1 23.4 8.4 4.7 7.5 Total 2,533 100.1 Source: Grunseit, Weatherburn and Donnelly, 2005
Self-reported participation in violence - trends Hemphill et al (2013): Occurrence of carrying a weapon and attacking someone with intent to harm among Victorian high school students in 1999 (n=7998), and in 2009 (n=9364). There were no significant differences over time in prevalence on either of the behavioural measures. Around 15% of respondents reporting weapon carriage at both times, and around 7% of respondents reported having attacked someone with intent to harm at both times. Does not necessarily mean violence participation is stable over time.
Self-report data - summary Very limited available information, whether in the form of wide-scale datasets, or location-focussed studies. It is inviting to think that participation in/frequency of juvenile offending has been relatively stable over time but the data are not robust enough to support any real conclusions. Variations in methods, questions, and reporting along with common use of school-based samples which do not capture all young people - place significant caveats around our existing state of knowledge. Intensity of participation remains largely unquantified, as does onset age.
Gaps in knowledge Patchy and inconsistent data, lack of fine geographic detail. Heavy reliance on official statistics (e.g., crimes recorded by police, cases processed by juvenile justice system) likely to understate magnitude of actual participation in offending behaviour, not uniformly reported, not always disaggregated by age/sex/offence. Lack of detailed information about specific offence types and details such as frequency of participation, severity of offending, and age of onset. Lack of longitudinal self-report data difficult to pick up changes over time in behaviours that may not be detected by authorities. Lack of general population sample self-report data school based samples, by their very nature, typically omit youth at highest risk. Lack of detailed information disaggregated by sex males and females may be displaying very different patterns of behaviour.
Broader context House of Representatives Standing Committee on Family, Community, Housing and Youth (2010) - Inquiry into the Impact of Violence on Young Australians, recommendation no. 1: measure the prevalence, nature and severity of youth violence and monitor trends over time. This recommendation has not been implemented.
Summary The data do not support claims of escalating youth violence. However, limits in current knowledge may hide specific changes in behaviour among certain groups of young people, or in specific sub-types of violent offending behaviour. Our young people do not seem to be any more out of control in recent years than they were several years ago but we really do not know. The Australian community needs an annual or bi- annual community based survey of youth.
