Arizona HIV/AIDS Epidemiological Data Analysis
Explore a comprehensive collection of data visualizations depicting HIV/AIDS trends in Arizona from 1982 to 2014, including case numbers, diagnoses, and prevalence rates. The visuals cover emergent cases, prevalent cases by county, and 5-year case rate trends, offering valuable insights into the epidemiology of HIV/AIDS in Arizona over the years.

Download Presentation

Please find below an Image/Link to download the presentation.
The content on the website is provided AS IS for your information and personal use only. It may not be sold, licensed, or shared on other websites without obtaining consent from the author. If you encounter any issues during the download, it is possible that the publisher has removed the file from their server.
You are allowed to download the files provided on this website for personal or commercial use, subject to the condition that they are used lawfully. All files are the property of their respective owners.
The content on the website is provided AS IS for your information and personal use only. It may not be sold, licensed, or shared on other websites without obtaining consent from the author.
E N D
Presentation Transcript
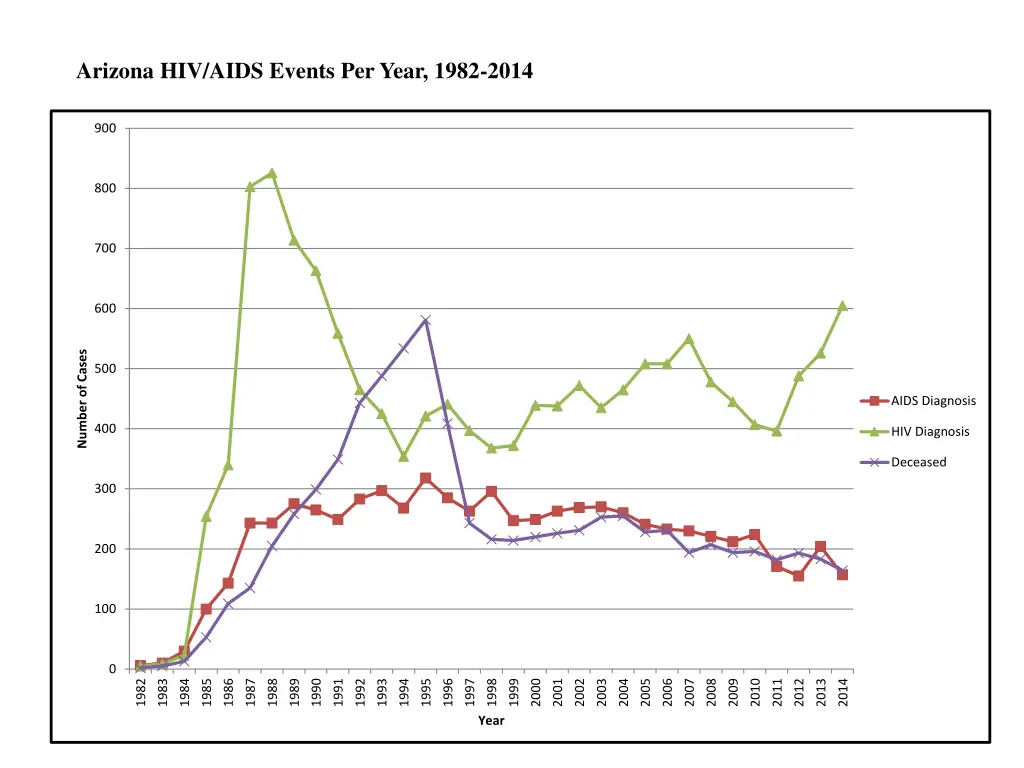
Arizona HIV/AIDS Events Per Year, 1982-2014 900 800 700 600 Number of Cases 500 AIDS Diagnosis 400 HIV Diagnosis Deceased 300 200 100 0 1982 1983 1984 1985 1986 1987 1988 1989 1990 1991 1992 1993 1994 1995 1996 1997 1998 1999 2000 2001 2002 2003 2004 2005 2006 2007 2008 2009 2010 2011 2012 2013 2014 Year
Arizona Emergent HIV/AIDS Diagnoses, 1999-2014 900 800 700 600 Number of Cases 500 AIDS HIV 400 300 200 100 0 1999 2000 2001 2002 2003 2004 2005 2006 2007 2008 2009 2010 2011 2012 2013 2014 Year
Arizona 5-Year Emergent HIV/AIDS Case Rate Trend, 1990-2012 25 20 Rate per 100,000 per year 15 10 5 0 5-Year Period
Arizona Single-Year Emergent HIV/AIDS Case Trend, 1990-2013 30 25 20 Rate per 100,000 per year 15 10 5 0 Year
Arizona Prevalent HIV, AIDS, and HIV/AIDS cases, December 2004 July 2014 18000 16000 14000 12000 Number of Cases 10000 HIV 8000 AIDS Total 6000 4000 2000 0
Arizona County-Specific Prevalent HIV/AIDS, 2014 300 250 State Prevalence Rate= 251 per 100,000 200 Rate per 100,000 150 100 50 0 *Incarcerated cases removed. 46% of prevalent cases in Pinal are currently incarcerated, and the rate before removal was 234. **Incarcerated cases removed. 28% of prevalent cases in Graham County are currently incarcerated, and the rate before removal was 85
Arizona County-Specific Emergent HIV/AIDS, 2009-2013 14 12 State Emergence Rate = 9.8 per 100,000 10 Rate per 100,000 8 6 4 2 0 *Incarcerated cases removed. 55% of incident cases in Pinal were incarcerated at the time of diagnosis, and the rate before removal was 9.81 **Incarcerated cases removed. 50% of incident cases in Graham were incarcerated at the time of diagnosis, and the rate before removal was 2.15
Arizona County-Specific Emergent HIV/AIDS, 2014 16 14 State Emergence Rate = 11.3 per 100,000 12 10 Rate per 100,000 8 6 4 2 0 * Incarcerated cases removed. 52% of incident cases in Pinal were incarcerated at the time of diagnosis. The rate before removal was 11.3 * * These counties had 0 incident cases in 2013.
Arizona Emergent HIV/AIDS by Gender, 2000-2014 25 20 15 Rate per 100,000 Males Females 10 5 0 2000 2001 2002 2003 2004 2005 2006 2007 2008 2009 2010 2011 2012 2013 2014 Year
Arizona 5-Year New HIV/AIDS Rate by Race/Ethnicity, 1990-2013 70 60 50 Rate per 100,00 40 White* Black* Hispanic A/PI/H* AI/AN* 30 20 10 0 5-Year Period *Non-Hispanic, A/PI/H=Asian/Pacific Islander/Native Hawaiian, AI/AN=American Indian/Alaska Native
Arizona Relative Percentage of Emergent Cases by Reported Risk Behavior, 1990-2013 80 70 60 Proportion of Emergent Cases 50 MSM IDU HRH OTHER NRR 40 30 20 10 0 5-Year Period
Arizona Percentage Relative Emergent Cases by Reported Risk Behavior and Sex, 2014 Females (2014) Males (2014) US Males (2010) Presumed Het 9% Other 1% NRR 3% HET 12% MSM/IDU 4% HRH 4% HRH 40% NRR 5% MSM/IDU 5% IDU 7% IDU 6% IDU 16% Presumed Het 37% Other 2% MSM 73% MSM 77% MSM =Men Who Have Sex with Men IDU = Injection Drug User HRH= High-Risk Heterosexual (heterosexual contact with a partner known to be HIV-infected or have a known HIV risk factor) NRR =No Risk Reported Presumed Het= Presumed Heterosexual Contact (no reported HIV risk factors except for heterosexual contact with a partner not classified as high-risk)
Male United States and Arizona Estimates of New HIV Infections, By Transmission Category AZ Males (2014) US Males (2010) US Males (2013) NRR 3% Other 1% MSM/IDU 3% HRH HET 12% 10% MSM/IDU 4% IDU 5% HRH 13% MSM/IDU 5% IDU 7% IDU 6% MSM 81% MSM 73% MSM 77% MSM =Men Who Have Sex with Men IDU = Injection Drug User HRH= High-Risk Heterosexual NRR =No Risk Reported The United States estimate does not include an NRR category
Female United States and Arizona Estimates of New HIV Infections, By Transmission Category AZ Females (2014) US Males (2010) US Females (2013) Other 2% NRR 5% HET 12% MSM/IDU 4% IDU 14% IDU 16% IDU 7% HRH 86% MSM 77% HRH 77% MSM =Men Who Have Sex with Men IDU = Injection Drug User HET= High-Risk Heterosexual NRR =No Risk Reported The United States estimate does not include an NRR category
Arizona Prevalent HIV/AIDS cases (2013) with at least one reported syphilis or gonorrhea diagnoses from 2009-2012 HIV and Syphilis, 435, 2.6% HIV only 15704, 94% Comorbid 989, 6% HIV and Gonorrhea, 455, 2.7% HIV, Syphilis and Gonorrhea 99, 0.6%


 with at least one")