Arizona HIV/AIDS Rates Among Women by Race/Ethnicity
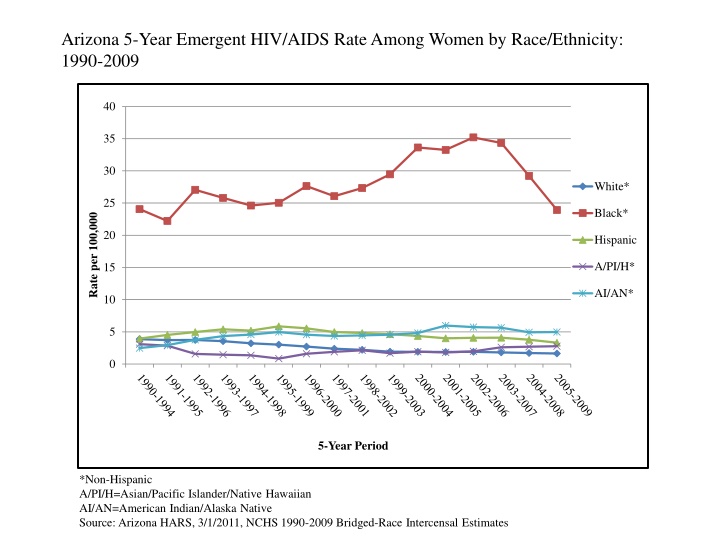
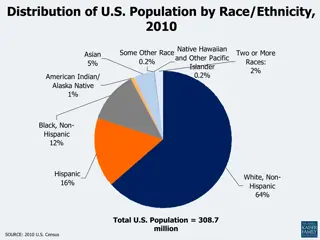
The data presents the 5-year emergent HIV/AIDS rates among women in Arizona from 1990 to 2009, segmented by race/ethnicity. It also highlights prevalent HIV/AIDS cases, emergent cases, and reported modes of exposure among different racial/ethnic groups. The information sheds light on the prevalence and distribution of HIV/AIDS in Arizona's female population over the specified period.

Download Presentation

Please find below an Image/Link to download the presentation.
The content on the website is provided AS IS for your information and personal use only. It may not be sold, licensed, or shared on other websites without obtaining consent from the author.If you encounter any issues during the download, it is possible that the publisher has removed the file from their server.
You are allowed to download the files provided on this website for personal or commercial use, subject to the condition that they are used lawfully. All files are the property of their respective owners.
The content on the website is provided AS IS for your information and personal use only. It may not be sold, licensed, or shared on other websites without obtaining consent from the author.
E N D
Presentation Transcript
Arizona 5-Year Emergent HIV/AIDS Rate Among Women by Race/Ethnicity: 1990-2009 40 35 30 White* 25 Black* Rate per 100,000 20 Hispanic A/PI/H* 15 AI/AN* 10 5 0 5-Year Period *Non-Hispanic A/PI/H=Asian/Pacific Islander/Native Hawaiian AI/AN=American Indian/Alaska Native Source: Arizona HARS, 3/1/2011, NCHS 1990-2009 Bridged-Race Intercensal Estimates
Arizona Prevalent HIV/AIDS, Emergent HIV/AIDS and State Population Among Women by Race/Ethnicity Current Female HIV/AIDS Prevalence % State Total Emergent Female HIV/AIDS 2005-2009 % State Total 2009 Female Population Rate Per 100,000 Rate Per 100,000 % State Total Race/Ethnicity Cases Cases Population White 831 5.8% 42.79 157 4.3% 1.64 1,942,177 30.00% non-Hispanic Black 491 3.4% 378.81 137 3.8% 23.93 129,616 1.85% non-Hispanic Hispanic A/PI/H 1 non-Hispanic AI/AN 2 non-Hispanic MR/ 3Other non- Hispanic 502 3.5% 51.51 149 4.1% 3.32 947,552 14.48% 34 0.2% 35.19 12 0.3% 2.77 96,619 1.40% 85 0.6% 58.23 35 1.0% 4.98 145,973 2.22% 44 0.3% N/A 15 0.4% N/A N/A N/A 1,987 13.9% 60.41 505 13.9% 3.21 3,288,937 49.8% TOTAL 1A/PI/H=Asian/Pacific Islander/Native Hawaiian 2AI/AN=American Indian/Alaska Native 3MR=Multi-Racial Source: Arizona HARS, 3/1/2011, NCHS 1990-2009 Bridged-Race Intercensal Estimates
Arizona Prevalent HIV/AIDS Among Women by Race/Ethnicity and Reported Mode of Exposure for Arizona s Three Largest Race/Ethnic Groups Prevalent Cases NRR 3 / Other Blood or Transplant Race/Ethnicity IDU 1 HRH 2 Vertical 8 17 White 831 289 (35%) 382 (46%) 135 (16%) (1%) (2%) non-Hispanic 0 24 Black 491 96 (20%) 259 (53%) 112 (23%) (0%) (5%) non-Hispanic 2 17 (3%) 502 108 (22%) 296 (59%) 79 (16%) (1%) Hispanic 1IDU=Injection Drug Use 2HRH=High-Risk Heterosexual Contact 3NRR=No Risk Reported Source: Arizona HARS, 3/1/2011, NCHS 1990-2009 Bridged-Race Intercensal Estimates
Arizona Prevalent HIV/AIDS Among Women by Race/Ethnicity and Reported Mode of Exposure for Arizona s Three Largest Race/Ethnic Groups Race/ Ethnicity Prevalent Cases Presumed Heterosexual NRR 3 / Other Blood or Transplant IDU 1 HRH 2 Vertical 8 17 White 831 284 (35%) 382 (46%) 121 (15%) 14 (1%) (1%) (2%) non-Hispanic 0 24 Black 491 96 (20%) 259 (53%) 104 (21%) 8 (2%) (0%) (5%) non-Hispanic 2 17 (3%) 502 108 (22%) 296 (59%) 69 (14%) 10 (2%) (1%) Hispanic 1IDU=Injection Drug Use 2HRH=High-Risk Heterosexual Contact 3NRR=No Risk Reported Source: Arizona HARS, 3/1/2011, NCHS 1990-2009 Bridged-Race Intercensal Estimates
Arizona HIV/AIDS Rate by Age at Emergent Infection Among Women by Race/Ethnicity: 2005-2009 70 60 50 White* Black* 40 Rate per 100,000 Hispanic 30 A/PI/H* 20 AI/AN* 10 0 5-Year Period *Non-Hispanic A/PI/H=Asian/Pacific Islander/Native Hawaiian AI/AN=American Indian/Alaska Native Source: Arizona HARS, 3/1/2011, NCHS 1990-2009 Bridged-Race Intercensal Estimates
Arizona Emergent HIV/AIDS Among Women in Urban and Rural Counties by Race/Ethnicity Female Female Female HIV/AIDS 2005-2009 Emergence: Maricopa County % County Female Total HIV/AIDS 2005-2009 Emergence: Pima County % County Female Total HIV/AIDS 2005-2009 Emergence: Rural Counties % Counties Female Total Rate Per 100,000 Rate Per 100,000 Rate Per 100,000 Race/Ethnicity Cases Cases Cases White 28.2 36.4 29 39.7 1.32 100 1.70 28 1.92 non-Hispanic Black 30.1 28.6 8 11.0 11.88 107 25.25 22 27.05 non-Hispanic Hispanic A/PI/H 1 non-Hispanic AI/AN 2 non-Hispanic MR3/ Other non- Hispanic 31.3 27.3 17 23.3 1.84 111 4.01 21 2.60 2.0 2.6 3 4.1 5.96 7 2.23 2 2.92 5.1 2.6 15 20.5 3.25 18 10.46 2 2.89 3.4 2.6 1 1.4 N/A 12 N/A 2 N/A TOTAL 355 (70%) 77 73 (% State Female 100.0 100.0 100.0 1.98 3.71 3.10 (14%) (15%) Cases) 1A/PI/H=Asian/Pacific Islander/Native Hawaiian 2AI/AN=American Indian/Alaska Native 3MR=Multi-Racial Source: Arizona HARS, 3/1/2011, NCHS 1990-2009 Bridged-Race Intercensal Estimates
Arizona Prevalent HIV/AIDS Among Women in Urban and Rural Counties by Race/Ethnicity Female Female Female HIV/AIDS Prevalence: Maricopa County % County Female Total HIV/AIDS Prevalence: Pima County % County Female Total HIV/AIDS Prevalence: Rural Counties % Counties Female Total Rate Per 100,000 Rate Per 100,000 Rate Per 100,000 Race/Ethnicity Cases Cases Cases White 39.0 44.5 167 50.5 36.72 519 43.67 145 48.48 non-Hispanic Black 27.7 24.8 41 12.4 253.31 369 386.82 81 449.05 non-Hispanic Hispanic A/PI/H 1 non-Hispanic AI/AN 2 non-Hispanic MR3/ Other non- Hispanic 26.0 23.9 78 23.6 39.19 346 57.47 78 44.97 1.7 1.5 6 1.8 52.94 23 32.69 5 33.51 3.3 2.8 32 9.7 33.76 44 120.77 9 61.03 2.2 2.5 7 2.1 N/A 29 N/A 8 N/A TOTAL 1330 (67%) 326 (16%) 331 (17%) (% State Female 100.0 42.65 13.6 66.75 14.0 62.66 Cases) 1A/PI/H=Asian/Pacific Islander/Native Hawaiian 2AI/AN=American Indian/Alaska Native 3MR=Multi-Racial Source: Arizona HARS, 3/1/2011, NCHS 1990-2009 Bridged-Race Intercensal Estimates
Arizona Deaths by Race/Ethnicity Among Person Reported With HIV/AIDS: 2005-2009 Males Death Rate Per 100,000 Per Year 5.31 Females Death Rate Per 100,000 Per Year 0.70 Race/Ethnicity Deaths Deaths 494 67 White non-Hispanic 90 223 4 14.56 4.60 1.03 28 30 0 4.89 0.67 0.00 Black non-Hispanic Hispanic A/PI/H 1 non-Hispanic 38 5.70 10 1.41 AI/AN 2 non-Hispanic 28 N/A 6 N/A MR/ 3Other non-Hispanic TOTAL 877 5.54 141 0.89 1A/PI/H=Asian/Pacific Islander/Native Hawaiian 2AI/AN=American Indian/Alaska Native 3MR=Multi-Racial Source: Arizona HARS, 3/1/2011, NCHS 1990-2009 Bridged-Race Intercensal Estimates
Ratio of Arizona HIV/AIDS 5-Year Emergent Rates Among Sexes by Race/Ethnicity: 2005-2009 1.0 0.9 0.8 0.7 Ratio of Women to Men 0.6 0.5 0.4 0.3 0.2 0.1 0.0 White* Black* Hispanic A/PI/H* AI/AN* Statewide Average= 0.16 *Non-Hispanic A/PI/H=Asian/Pacific Islander/Native Hawaiian AI/AN=American Indian/Alaska Native Source: Arizona HARS, 3/1/2011, NCHS 1990-2009 Bridged-Race Intercensal Estimates
Arizona 5-Year Emergence Rate by Proportion of Women to Men by Race/Ethnicity: 2005-2009 0.6 Black* 0.5 Ratio of Women to Men 0.4 0.3 A/PI/H* AI/AN* 0.2 Hispanic 0.1 White* 0 0 5 10 15 20 25 30 35 40 5-Year Emergence Rate Per 100,000 *Non-Hispanic A/PI/H=Asian/Pacific Islander/Native Hawaiian AI/AN=American Indian/Alaska Native Source: Arizona HARS, 3/1/2011, NCHS 1990-2009 Bridged-Race Intercensal Estimates
5-Year Emergence Rate by Proportion of Women to Men by Race/Ethnicity: Arizona (2005-2009) vs. South Africa (2005) 3 2.5 South Africa, 2005 Ratio of Women to Men 2 1.5 1 Arizona Black Non- Hispanics 0.5 All Other Arizona Race/Ethnic Groups 0 0 200 400 5-Year Emergence Rate Per 100,000 600 800 1000 1200