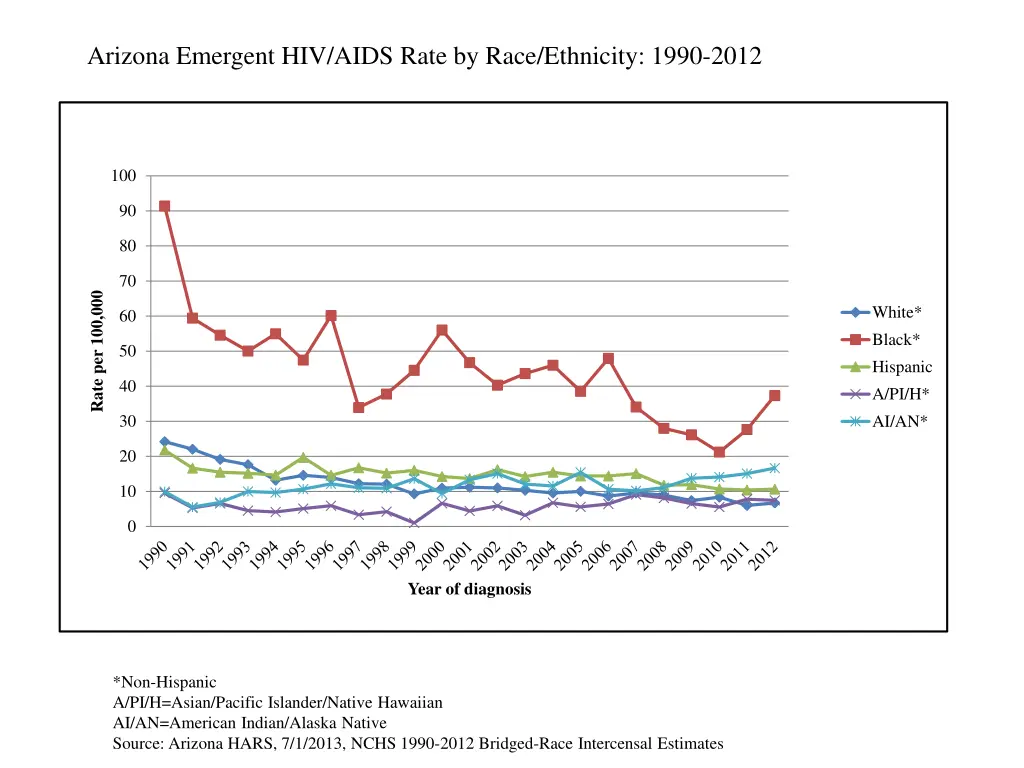
Explore the Arizona HIV/AIDS rates by race/ethnicity from 1990 to 2012, including rates among women and men, prevalent and emergent cases, and state population statistics. Data on White, Black, Hispanic, Asian/Pacific Islander/Native Hawaiian, American Indian/Alaska Native populations are presented.
Please find below an Image/Link to download the presentation.
The content on the website is provided AS IS for your information and personal use only. It may not be sold, licensed, or shared on other websites without obtaining consent from the author. If you encounter any issues during the download, it is possible that the publisher has removed the file from their server.
You are allowed to download the files provided on this website for personal or commercial use, subject to the condition that they are used lawfully. All files are the property of their respective owners.
The content on the website is provided AS IS for your information and personal use only. It may not be sold, licensed, or shared on other websites without obtaining consent from the author.
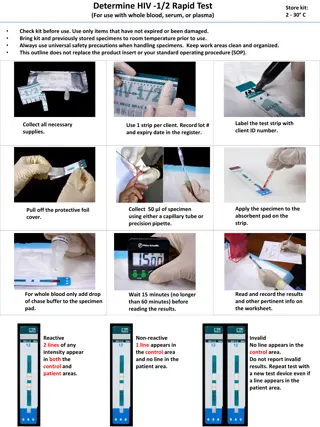
Arizona Emergent HIV/AIDS Rate Among Women by Race/Ethnicity: 1990-2012 50 45 40 35 Rate per 100,000 White* Black* Hispanic A/PI/H* AI/AN* 30 25 20 15 10 5 0 Year of diagnosis *Non-Hispanic A/PI/H=Asian/Pacific Islander/Native Hawaiian AI/AN=American Indian/Alaska Native Source: Arizona HARS, 7/1/2013, NCHS 1990-2012 Bridged-Race Intercensal Estimates
Arizona Emergent HIV/AIDS Rate Among Men by Race/Ethnicity: 1990-2012 160 140 120 Rate per 100,000 100 White* Black* Hispanic A/PI/H* AI/AN* 80 60 40 20 0 Year of diagnosis *Non-Hispanic A/PI/H=Asian/Pacific Islander/Native Hawaiian AI/AN=American Indian/Alaska Native Source: Arizona HARS, 7/1/2013, NCHS 1990-2012 Bridged-Race Intercensal Estimates
Arizona Prevalent HIV/AIDS, Emergent HIV/AIDS and State Population Among Women by Race/Ethnicity 2012 Female HIV/AIDS Prevalence % State Total 2012 Emergent Female HIV/AIDS % State Total 2012 Female Population Rate Per 100,000 Rate Per 100,000 % State Total Race/Ethnicity Cases Cases Population White 880 5.8% 45.79 29 4.5% 1.51 non-Hispanic 1,921,924 29.3% Black 572 3.7% 418.28 34 5.3% 24.86 non-Hispanic Hispanic A/PI/H 1 non-Hispanic AI/AN 2 non-Hispanic MR/ 3Other non- Hispanic 136,750 980,688 2.1% 15.0% 520 3.4% 53.02 16 2.5% 1.63 44 0.3% 38.72 6 0.9% 5.28 113,631 1.7% 104 0.7% 73.35 10 1.6% 7.05 141,779 2.2% 43 0.3% N/A 0 0.0% N/A N/A N/A 2,163 14.1% 65.65 95 14.8% 2.88 50.3% TOTAL 3,294,772 1A/PI/H=Asian/Pacific Islander/Native Hawaiian 2AI/AN=American Indian/Alaska Native 3MR=Multi-Racial Source: Arizona HARS, 12/31/2012 (prevalence) and 7/1/2012 (emergence), NCHS 2011 Bridged-Race Intercensal Estimate 2012
Arizona Prevalent HIV/AIDS, Emergent HIV/AIDS and State Population Among Men by Race/Ethnicity 2012 Male 2012 Emergent Male HIV/AIDS % State Total 2012 Male Population HIV/AIDS Prevalence % State Total Rate Per 100,000 Rate Per 100,000 % State Total Race/Ethnicity Cases Cases Population White 7645 50.0% 407.32 227 35.2% 12.09 28.6% non-Hispanic 1,876,883 Black 1239 8.1% 826.45 73 11.3% 48.69 2.3% non-Hispanic Hispanic A/PI/H 1 non-Hispanic AI/AN 2 non-Hispanic MR/ 3Other non- Hispanic 149,919 995,418 3446 22.5% 346.19 195 30.3% 19.59 15.2% 168 1.1% 165.00 10 1.6% 9.82 1.6% 101,818 432 2.8% 321.32 36 5.6% 26.78 2.1% 134,445 195 1.3% N/A 8 1.2% N/A N/A N/A 13,125 85.9% 402.79 549 85.2% 16.82 49.7% TOTAL 3,258,483 1A/PI/H=Asian/Pacific Islander/Native Hawaiian 2AI/AN=American Indian/Alaska Native 3MR=Multi-Racial Source: Arizona HARS, 12/31/2012 (prevalence) and 7/1/2012 (emergence), NCHS 2011 Bridged-Race Intercensal Estimate 2012
Arizona HIV/AIDS Prevalence Rates by Sex and Race/Ethnicity, 2012 900 800 700 600 Rate per 100,000 500 Male Female 400 300 200 100 0 All Cases White* Black* Race/Ethnicity Hispanic A/PI/H* AI/AN* *Non-Hispanic A/PI/H=Asian/Pacific Islander/Native Hawaiian AI/AN=American Indian/Alaska Native Source: Arizona HARS, 12/31/2012, NCHS 2012 Bridged-Race Intercensal Estimate
Arizona HIV/AIDS Emergence Rates by Sex and Race/Ethnicity, 2012 55 50 45 40 35 Rate per 100,000 30 Male Female 25 20 15 10 5 0 All Cases White* Black* Race/Ethnicity Hispanic A/PI/H* AI/AN* *Non-Hispanic A/PI/H=Asian/Pacific Islander/Native Hawaiian AI/AN=American Indian/Alaska Native Source: Arizona HARS, 7/1/2013, NCHS 2012 Bridged-Race Intercensal Estimate
Ratio of Arizona HIV/AIDS Emergent Case Count Among Sexes by Race/Ethnicity, 2012 1.0 0.9 0.8 0.7 Ratio of Women to Men N=16 0.6 N=107 0.5 0.4 N=46 0.3 N=256 0.2 N=211 0.1 0.0 White* Black* Hispanic A/PI/H* AI/AN* Statewide Average= 0.18 *Non-Hispanic A/PI/H=Asian/Pacific Islander/Native Hawaiian AI/AN=American Indian/Alaska Native Source: Arizona HARS, 7/1/2013, NCHS 2012 Bridged-Race Intercensal Estimate
Arizona Prevalent HIV/AIDS Among Women by Race/Ethnicity and Reported Mode of Exposure for Arizona s Three Largest Race/Ethnic Groups Race/ Ethnicity Prevalent Cases Presumed Heterosexual NRR 3 / Other Blood or Transplant IDU 1 HRH 2 Vertical 7 16 (2%) White 880 306 (35%) 417(47%) 116 (13%) 18 (2%) (1%) non-Hispanic 0 29 Black 572 92 (16%) 324 (57%) 120 (21%) 7 (1%) (0%) (5%) non-Hispanic 2 18 (3%) 520 107 (21%) 311 (59%) 71 (14%) 11 (2%) (<1%) Hispanic 1IDU=Injection Drug Use 2HRH=High-Risk Heterosexual Contact 3NRR=No Risk Reported Source: Arizona HARS, 12/31/2012
Arizona Prevalent HIV/AIDS Among Women by Race/Ethnicity and Reported Mode of Exposure for Arizona s Three Largest Race/Ethnic Groups Race/ Ethnicity Prevalent Cases NRR 3 / Other Blood or Transplant IDU 1 Vertical Any Heterosexual 7 16 (2%) White 880 306 (35%) 533 (61%) 18 (2%) (1%) non-Hispanic 0 29 Black 572 92 (16%) 444 (78%) 7 (1%) (0%) (5%) non-Hispanic 2 18 (3%) 520 107 (21%) 382 (73%) 11 (2%) (<1%) Hispanic 1IDU=Injection Drug Use 2HRH=High-Risk Heterosexual Contact 3NRR=No Risk Reported Source: Arizona HARS, 12/31/2012
Arizona Prevalent HIV/AIDS Among Men by Race/Ethnicity and Reported Mode of Exposure for Arizona s Three Largest Race/Ethnic Groups Race/ Ethnicity Prevalent Cases Presumed Heterosexual NRR 4 / Other Blood or Transplant MSM 1 IDU 2 MSM/IDU HRH 3 Vertical White non- Hispanic Black non- Hispanic 5704 (74%) 29 7645 511 (7%) 772 (10%) 204 (3%) 142 (2%) 250 (3%) 33 (<1%) (<1%) 684 (55%) 160 (13%) 1239 130 (11%) 91 (7%) 53 (4%) 92 (7%) 3 (<1%) 26 (2%) 2315 (67%) 14 3446 324 (9%) 304 (9%) 169 (5%) 139 (5%) 172 (5%) 9 (<1%) (<1%) Hispanic Race/ Ethnicity Any MSM 1 Any IDU 2 White 6287 (84%) 1237 (17%) non-Hispanic Black 763 (64%) 304 (26%) non-Hispanic 2457 (76%) 606 (19%) Hispanic 1MSM=Men who have sex with men 2IDU=Injection Drug Use 3HRH=High-Risk Heterosexual Contact 4NRR=No Risk Reported Source: Arizona HARS, 12/31/2012, NCHS 2012 Bridged-Race Intercensal Estimate
Arizona Deaths by Sex and Race/Ethnicity Among Person Reported With HIV/AIDS, 2010 Males Death Rate Per 100,000 Per Year 5.35 Females Death Rate Per 100,000 Per Year .41 Race/Ethnicity Deaths Deaths 101 8 White non-Hispanic 22 38 1 15.90 3.59 1.15 5 4 0 3.86 .41 0.00 Black non-Hispanic Hispanic A/PI/H 1 non-Hispanic 9 6.56 3 2.06 AI/AN 2 non-Hispanic 1 N/A 0 N/A MR/ 3Other non-Hispanic TOTAL 172 5.20 20 0.61 Note: This is the most recent year for which comprehensive death reports are available 1A/PI/H=Asian/Pacific Islander/Native Hawaiian 2AI/AN=American Indian/Alaska Native 3MR=Multi-Racial Source: Arizona HARS, 7/1/2013, NCHS 2012 Bridged-Race Intercensal Estimate
Arizona Unmet Need by Sex and Race/Ethnicity Among Person Reported With HIV/AIDS, 2012 Males Females % Cases with Unmet Need 42% % Cases with Unmet Need 42% Race/Ethnicity White non-Hispanic 47% 47% 36% 35% 39% 23% Black non-Hispanic Hispanic A/PI/H 1 non-Hispanic 25% 31% AI/AN 2 non-Hispanic 71% 65% MR/ 3Other non-Hispanic TOTAL 43% 39% A person is considered to have an Unmet Need for HIV primary care if there is no record of them having a laboratory test, doctor s visit or taking HIV medication. 1A/PI/H=Asian/Pacific Islander/Native Hawaiian 2AI/AN=American Indian/Alaska Native 3MR=Multi-Racial Source: Arizona HARS, 12/31/2012
Arizona Unmet Need by Sex and Reported Race/Ethnicity Among Person Reported With HIV/AIDS, 2012 Males Females % Cases with Unmet Need 40% % Cases with Unmet Need 42% Race/Ethnicity Ever reported as White 46% 36% Ever reported as Black Ever reported as Hispanic 47% 39% 28% 32% Ever reported as A/PI/H 1 36% 25% Ever reported as AI/AN 2 This table splits each multiple race case into the reported races/ethnicities; some persons are therefore in more than one row. A person is considered to have an Unmet Need for HIV primary care if there is no record of them having a laboratory test, doctor s visit or taking HIV medication. 1A/PI/H=Asian/Pacific Islander/Native Hawaiian 2AI/AN=American Indian/Alaska Native 3MR=Multi-Racial Source: Arizona HARS, 12/31/2012
Arizona Race/Ethnicity Classification Among Prevalent Cases, 2012 Males Ever reported as 10527 Females Ever reported as 1315 Categorized as 7645 Percent Change 37.7% Categorized as 880 Percent Change 49.4% Race/Ethnicity White non-Hispanic 1239 3446 168 1335 3448 205 7.8% <0.1% 22.0% 572 520 44 597 521 48 4.4% 0.2% 9.1% Black non-Hispanic Hispanic A/PI/H 1 non-Hispanic 432 513 18.8% 104 126 21.2% AI/AN 2 non-Hispanic 195 N/A N/A 43 N/A N/A MR/ 3Other non-Hispanic A case is categorized as being in one of these six race/ethnicity groups. A case can be reported as more than one race/ethnicity. 1A/PI/H=Asian/Pacific Islander/Native Hawaiian 2AI/AN=American Indian/Alaska Native 3MR=Multi-Racial Source: Arizona HARS, 12/31/2012