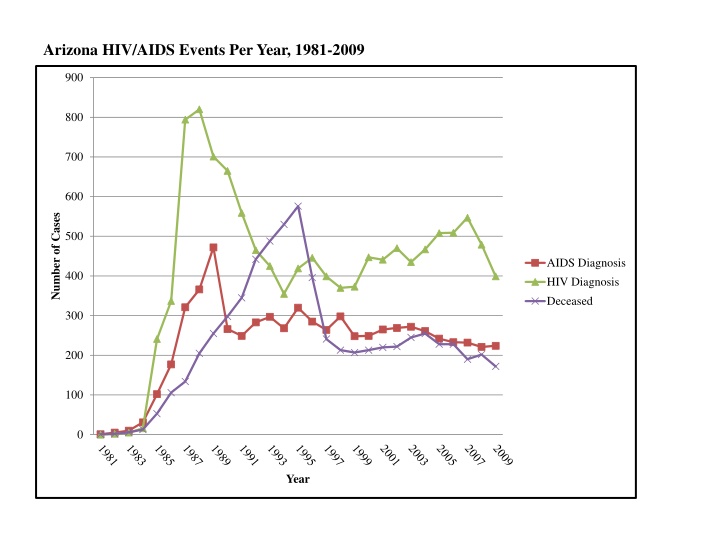
Explore a comprehensive overview of HIV/AIDS data in Arizona from 1981 to 2009, including the number of cases per year, emergent diagnoses, prevalent cases, county-specific rates, gender distribution, and rates by race/ethnicity. Discover key insights into the impact of HIV/AIDS in Arizona through detailed visual representations.
Please find below an Image/Link to download the presentation.
The content on the website is provided AS IS for your information and personal use only. It may not be sold, licensed, or shared on other websites without obtaining consent from the author. If you encounter any issues during the download, it is possible that the publisher has removed the file from their server.
You are allowed to download the files provided on this website for personal or commercial use, subject to the condition that they are used lawfully. All files are the property of their respective owners.
The content on the website is provided AS IS for your information and personal use only. It may not be sold, licensed, or shared on other websites without obtaining consent from the author.
Arizona County-Specific Prevalent HIV/AIDS, 2011 250 State Prevalence Rate= 216 200 150 Rate per 100,000 100 50 0 *56% of prevalent cases in Pinal County are among persons currently incarcerated **36% of prevalent cases in Graham County are among persons currently incarcerated
Arizona County-Specific Emergent HIV/AIDS, 2005-2009 18 16 14 12 State Emergence Rate = 11.5 Rate per 100,000 10 8 6 4 2 0 *68% of emergent cases in Pinal County are among persons incarcerated at the time of diagnosis **36% of emergent cases in Graham County are among persons incarcerated at the time of diagnosis
Male United States and Arizona Estimates of New HIV Infections, By Transmission Category AZ Males US Males HET 3% HET 13% NRR/OTHER 13% MSM/IDU 7% MSM/IDU 6% IDU 7% IDU 17% MSM 63% MSM 71% MSM =Men Who Have Sex with Men IDU = Injection Drug User NRR =No Risk Reported
Female United States and Arizona Estimates of New HIV Infections, By Transmission Category US Females AZ Females Other 1% IDU 26% IDU 21% NRR/OTHER 39% Heterosexual 73% HETEROSEXUAL 40% IDU = Injection Drug User NRR =No Risk Reported
Arizona Lifetime Comorbidity Patterns Among Persons Diagnosed with HIV/AIDS, Sexually Transmitted Diseases or Hepatitis C, 1998-2008 2,090 134 HIV/AIDS (n=20,578) 1,032 Sexually Transmitted Diseases (n=199,568) Hepatitis C (n=47,697) Total HIV/AIDS= 23,834 Total STD= 203,829 TotalHepatitis C=50,900 2,037