Arizona Prevalent HIV Care Engagement Statistics
Explore the prevalent cases of HIV care engagement in Arizona in 2012, including statistics on HIV-infected individuals, diagnosed cases, care retention, need for ARV therapy, and more. Understand the breakdown by sex and race/ethnicity to gain insights into the HIV care landscape.

Download Presentation

Please find below an Image/Link to download the presentation.
The content on the website is provided AS IS for your information and personal use only. It may not be sold, licensed, or shared on other websites without obtaining consent from the author. If you encounter any issues during the download, it is possible that the publisher has removed the file from their server.
You are allowed to download the files provided on this website for personal or commercial use, subject to the condition that they are used lawfully. All files are the property of their respective owners.
The content on the website is provided AS IS for your information and personal use only. It may not be sold, licensed, or shared on other websites without obtaining consent from the author.
E N D
Presentation Transcript
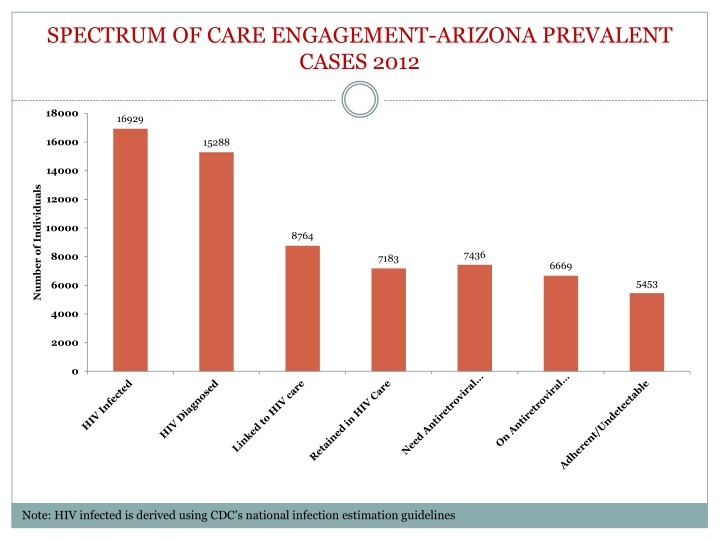
SPECTRUM OF CARE ENGAGEMENT-ARIZONA PREVALENT CASES 2012 18000 16929 16000 15288 14000 Number of Individuals 12000 10000 8764 7436 8000 7183 6669 5453 6000 4000 2000 0 Note: HIV infected is derived using CDC s national infection estimation guidelines
Definitions HIV-Infected Prevalent cases and estimated unaware cases of HIV infection (end of year) HIV-Diagnosed Prevalent cases Linked to HIV Care Prevalent cases with a documented lab test, doctor visit or medication use in the calendar year Retained in HIV Care Prevalent cases with a documented lab test, doctor visit or anti-retroviral (ARV) use in this calendar year and last calendar year Need ARV Therapy Prevalent cases whose last CD4 count of the calendar year was less than 350/ L, whose last viral load of the calendar year was greater than 100,000 copies/mL , who had a documented opportunistic infection or who had documented ARV use during the calendar year On ARV Therapy Prevalent cases with documented ARV use or whose last viral load of the calendar year was undetectable Adherent/Undetectable Prevalent cases whose last viral load of the calendar year was undetectable
SPECTRUM OF CARE ENGAGEMENT-ARIZONA PREVALENT CASES 2012 100% 100% 90% 80% 70% 57% 60% 49% 50% 47% 44% 40% 36% 30% 20% 10% 0% HIV Diagnosed Linked to HIV Care Retained in HIV Care Need ARV Therapy On ARV Therapy Adherant/ Undetectable VL Note: HIV infected is derived using CDC s national infection estimation guidelines
SPECTRUM OF CARE ENGAGEMENT- AZ PREVALENT CASES BY SEX 2012 100% 100% 100% 90% 80% * 70% 61% Male 60% 57% * * Female 50% 50% 48% 50% 46% 44% 44% 40% 36% 36% 30% 20% 10% 0% HIV Diagnosed Linked to HIV Care Retained in HIV Care Need ARV Therapy On ARV Therapy Adherant/ Undetectable VL *Significantly different (p <.05) than male when controlling for age, population density, and race/ethnicity(logistic regression)
SPECTRUM OF CARE ENGAGEMENT- AZ PREVALENT CASES BY RACE/ETHNICITY 2012 100% American Indian/Alaska Native Non-Hispanic Asian/Pacific Islander/Native Hawaiian Non-Hispanic White Non-Hispanic Black Non-Hispanic Hispanic Multi-Race/Other/Unknown * * 90% 80% 70% * ** 60% * 50% ** * * * ** 40% * * * 30% * * * 20% * 10% 0% *Significantly different (p <.05) than Whites when controlling for age, sex, and county population density (logistic regression)