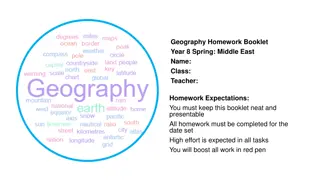
Asia Geography Homework Expectations for Year 8 Students" (57 characters)

This booklet provides guidelines for Year 8 students on completing geography homework related to Asia. Students are required to maintain neat presentation, complete all tasks by the set dates, and demonstrate high effort in their work. All assignments should be written in red pen as specified. By following these expectations, students can enhance their understanding of Asian geography and excel in their learning journey.

Download Presentation

Please find below an Image/Link to download the presentation.
The content on the website is provided AS IS for your information and personal use only. It may not be sold, licensed, or shared on other websites without obtaining consent from the author.If you encounter any issues during the download, it is possible that the publisher has removed the file from their server.
You are allowed to download the files provided on this website for personal or commercial use, subject to the condition that they are used lawfully. All files are the property of their respective owners.
The content on the website is provided AS IS for your information and personal use only. It may not be sold, licensed, or shared on other websites without obtaining consent from the author.
E N D
Presentation Transcript
Geography Homework Booklet Year 8 : Asia Name: Class: Teacher: Homework Expectations: You must keep this booklet neat and presentable All homework must be completed for the date set High effort is expected in all tasks You will boost all work in red pen
Year 8 Weekly Homework 1.1 Physical Features of Asia KB: page 11-12 1. Are these statements TRUE or FALSE? 2. Draw a diagram to show how a monsoon forms: 1. Asia means WEST: _______________________ 2. There are 49 countries in Asia: _______________________ 3. It has a population of 2.3 billion _______________________ 4. 75% of its population is found in India _______________________ 5. Turkey is in Asia _______________________ 6. There are no mountains in Asia _______________________ 3. Answer the following questions: 4. Connect these words: July September 1. What mountain range is found in Asia? Rain 2. What is the worlds tallest mountain? 3. How many metres above sea level is it? 50% Agriculture 4. What is the name of the desert in Asia? 15% 5. Name both of the Oceans that can be found in Asia: 3/4
Year 8 Weekly Homework 1.2 2017 Bangladesh Floods in Asia Knowledge Book: Page 14-15 1. Answer the following questions: 2. What caused the flooding in Bangladesh complete the diagram: a) How many people died in the floods? _______________________ b) How many children were affected? ____________________ c) What country saw 8 million people affected? _______________________ d) How many homes were destroyed? ______________________________ e) What % of those killed were children? _______________ 3. Are these statements TRUE or FALSE? 1. A cyclone is just a bad thunder storm TRUE/FALSE 2. There 2 million homes destroyed in Nepal: TRUE/FALSE 3. 31 million people in India lost their jobs/homes/cattle/property: TRUE/FALSE 4. 80% of Bangladesh lies on a flood plain TRUE/FALSE 5. Deforestation was a cause of the 2017 floods TRUE/FALSE 6. Rivers split due to soil erosion TRUE/FALSE 7. The Bay of Bengal is in Bangladesh TRUE/FALSE
Year 8 Weekly Homework 1.3 The Biomes in Asia Knowledge Book P16-17 1. Label Nepal on this diagram 2. Make links between the words explain at least 4 links you make Nepal Poverty Flood Erosion Timber Deforestation 4. Use page 10 to add detail to this diagram about the impact of deforestation: 3. List 5 reasons for deforestation in Nepal 1. ____________________________________________________________ ____________________________________________________________ 2. ____________________________________________________________ ____________________________________________________________ 3. ____________________________________________________________ ____________________________________________________________ 4. ____________________________________________________________ ____________________________________________________________ 5. ____________________________________________________________ ____________________________________________________________
Year 8 Weekly Homework 1.4 Asia: Population: Japan vs Afghanistan Knowledge Book 18-22 3. Which countries population pyramid is this? Explain what it shows. 1. Compare the population statistics of Japan and Afghanistan: _______________________ _______________________ _______________________ _______________________ _______________________ _______________________ _______________________ _______________________ _______________________ Country Japan Afghanistan Population Life expectancy Birth rate Future? 2. Which countries population pyramid is this? Explain what it shows. 4. How should we solve the population problems in Japan and Afghanistan _______________________ _______________________ _______________________ _______________________ _______________________ _______________________ _______________________ _______________________ _______________________ Issue Solution Japan has an ageing, shrinking population There is a shortage of workers in Japan The population in Afghanistan is set to double Women have an average of 6 children in their lifetimes
Year 8 Weekly Homework 1.5 Map Skills: Grid References 1. Complete the questions on 4 and 6 figure grid references: 4 Figure Grid References: a) What is the 4 figure grid reference for the ? _______________________________ b) What is the 4 figure grid reference for the ? _______________________________ c) What is the 4 figure grid reference for the ? _______________________________ d) What is the 4 figure grid reference for the ? _______________________________ e) Which shape is found in grid reference 21,48? _________________________________ f) Which shape is found in grid reference 23,48? _________________________________ g) Which shape is found in grid reference 22,45? _________________________________ h) Draw a in grid reference 23,45 6 Figure Grid References: a) What is the 6 figure grid reference for the ? _______________________________ b) What is the 6 figure grid reference for the ? _______________________________ c) What is the 6 figure grid reference for the ? _______________________________ d) What is the 6 figure grid reference for the ? _______________________________ e) Which shape is found in grid reference 243,458? ______________________________ f) Which shape is found in grid reference 223,453? ______________________________ g) Which shape is found in grid reference 212,452? ______________________________ h) Draw a in grid reference 245,477
Year 8 Weekly Homework 1.6 Urbanisation in Karnataka: Bangalore Knowledge Book: P23-24 1. Are these statements TRUE or FALSE? 3. Study the map below. Describe the location of Bangalore using the CLOCK acronym (4): a) Bangalore has a population of over 1 million _______________________ b) Infant mortality rate is 24 deaths / 1000 _______________________ c) Karnataka has a population of 6.1 million _______________________ C Continent/ Country L Latitude O Ocean / Seas C Compass Points K Kilometres (distance) d) 40% of the population is under 3yrs old _______________________ e) Karnataka is located in South-West India _______________________ f) 32% of people live below the poverty line _______________________ 3. Use P23 Identify 2 causes, 2 effects, 2 responses to Bangalores increasing population. Causes: Effects (problems): Responses: ____________________________________________________________________________ Rain Push Factor: ____________________________________________________________________________ ____________________________________________________________________________ ____________________________________________________________________________ ____________________________________________________________________________ ____________________________________________________________________________ Pull Factor: ____________________________________________________________________________ ____________________________________________________________________________ ____________________________________________________________________________ ____________________________________________________________________________
Year 8 Weekly Homework 1.7 China s Economic Growth Knowledge Book: Page 25-26 1. Answer the following questions: 3. Study the map below and on P25. Describe the journey of the belt and road initiative over land (orange line) and over sea (blue dotted line) (4): a) What is the belt and road initiative? ___________________________________________ ____________________________________________________________________________ b) When was the belt and road initiative created? __________________________________ N c) What infrastructure is being built to allow for more trading routes? __________________ ____________________________________________________________________________ d) How many countries have supported the belt and road initiative? ___________________ e) TRUE or FALSE: China is the biggest producer and consumer of coal? _________________ f) Since 1990, how many people in China have been lifted out of poverty? ______________ 2. P24- Explain two reasons behind China s economic growth: One reason is ______________________________________. This can improve economic ____________________________________________________________________________ growth because _____________________________________________________________ ____________________________________________________________________________ ____________________________________________________________________________ ____________________________________________________________________________ ____________________________________________________________________________ ____________________________________________________________________________ ____________________________________________________________________________ ____________________________________________________________________________ Another reason is ______________________________________. This can enhance ____________________________________________________________________________ economic growth because ____________________________________________________ ____________________________________________________________________________ ____________________________________________________________________________ ____________________________________________________________________________ ____________________________________________________________________________ ____________________________________________________________________________ ____________________________________________________________________________ ____________________________________________________________________________
Year 8 Weekly Homework 1.8 Asia: World Trade Knowledge Book P27 1. Are these statements TRUE or FALSE? 3. Describe the change in percentage of global manufacturing output for China and the Rest of Asia, from the year 1990 to 2013. a) China and India rank in the top 10 countries for global wealth: ________________ b) The economic growth is known as Asian Wonder ________________ c) It s estimated India s economy will overtake USA by 2020 ________________ d) By 2050 China s economy will be 50% bigger than America s ________________ e) Wages for factory workers in China average $6.70 per day ________________ f) China held the largest % of global output in 1990 ________________ g) Europe s % of global output decreased from 1990- 2013 ________________ 2. Connect these words then write along the lines to explain how they are connected: ____________________________________________________________________________ ____________________________________________________________________________ China Wages ____________________________________________________________________________ ____________________________________________________________________________ ____________________________________________________________________________ ____________________________________________________________________________ Global Wealth ____________________________________________________________________________ ____________________________________________________________________________ ____________________________________________________________________________ ____________________________________________________________________________ ____________________________________________________________________________ 2050 Vietnam
Year 8 Weekly Homework Autumn 1.9 China s One Child Policy Knowledge Book 28-29 1. Use P27 and P28 to answer the following questions: 3. Read P27 and P28 and identify advantages and disadvantages of the one child policy: Advantages of the Policy Disadvantages of the Policy a) What was the population of China in 1970? _____________________________________ b) How much was the population have expected to grow by 2020? ____________________ c) In what year was the one child policy introduced? ________________________________ d) For how many years was the one child policy in place? ____________________________ e) TRUE or FALSE: China now has a young dependent population? _____________________ f) How many more marriage-age men are there than women? ________________________ g) How much has the population decreased by since the policy? _______________________ 2. Use P27 and P28 to fill in the details about China s population pyramids: Diagram Which Year? Describe the shape of the pyramid What problems occur due to this kind of population?
Year 8 Weekly Homework 2.0 Nepal Earthquake Knowledge Book 30, 34-36 1. Label the diagram correctly: Seismic Waves / Focus / Epicentre 3. Fill in the key terms and definitions for the following: Key Term Definition Conservative plate boundary Waves of energy that travel through the Earth s surface. Epicentre Focus Pieces of Earth s crust and uppermost mantle. 2. Use P34 to P36 to answer the following questions: 4. Connect these words then write along the lines to explain how they are connected: a) What was the date of earthquake? ____________________________________________ Economy Nuclear Power b) What time did the earthquake occur? __________________________________________ c) How powerful was the Earthquake on the Richter Scale ? _________________ d) What plates were involved ? ____________________________ Tohoku Earthquake e) Where was the epicentre? ___________________________________________________ f) How high was the Tsunami wave ? ____________________________________ g) How many people died because of the earthquake? ______________________________ Transport 6,152
Year 8 Weekly Homework 2.1 Map Skills: Scale, Distance, Compass Points and Grid References Interpreting Scale: N a) 2cm on the map is what distance in real life? _______________________________ b) 3cm on the map is what distance in real life? _______________________________ c) 0.5km in real life is how many cm on the map? ____________________________ d) 4.5km in real life is how many cm on the map? ____________________________ Measuring Distance: a) On the map, how many cm apart are and ? _____________________ b) On the map, how many cm apart are and ? _____________________ c) In real life, how far apart in km are and ? _______________________ d) In real life, how far apart in km are and ? _______________________ Compass Points (Identify the correct compass direction): a) To get from to you travel ___________________________________ b) To get from to you travel ___________________________________ c) To get from to you travel ___________________________________ d) To get from to you travel ___________________________________ 6- Figure Grid References: a) What is the 6 figure grid reference for the ? ____________________________ b) Which shape is found in grid reference 225,468? ____________________________ 2cm 2cm: 1km c) Draw a in grid reference 236,453 1km