Asia-Pacific HIV and AIDS Data Review
Explore the latest data on HIV and AIDS in Asia-Pacific, including socio-demographic indicators, HIV prevalence, epidemiology, risk behaviors, and more. Stay informed with key statistics and trends to support effective responses and interventions in the region.
Download Presentation

Please find below an Image/Link to download the presentation.
The content on the website is provided AS IS for your information and personal use only. It may not be sold, licensed, or shared on other websites without obtaining consent from the author. If you encounter any issues during the download, it is possible that the publisher has removed the file from their server.
You are allowed to download the files provided on this website for personal or commercial use, subject to the condition that they are used lawfully. All files are the property of their respective owners.
The content on the website is provided AS IS for your information and personal use only. It may not be sold, licensed, or shared on other websites without obtaining consent from the author.
E N D
Presentation Transcript
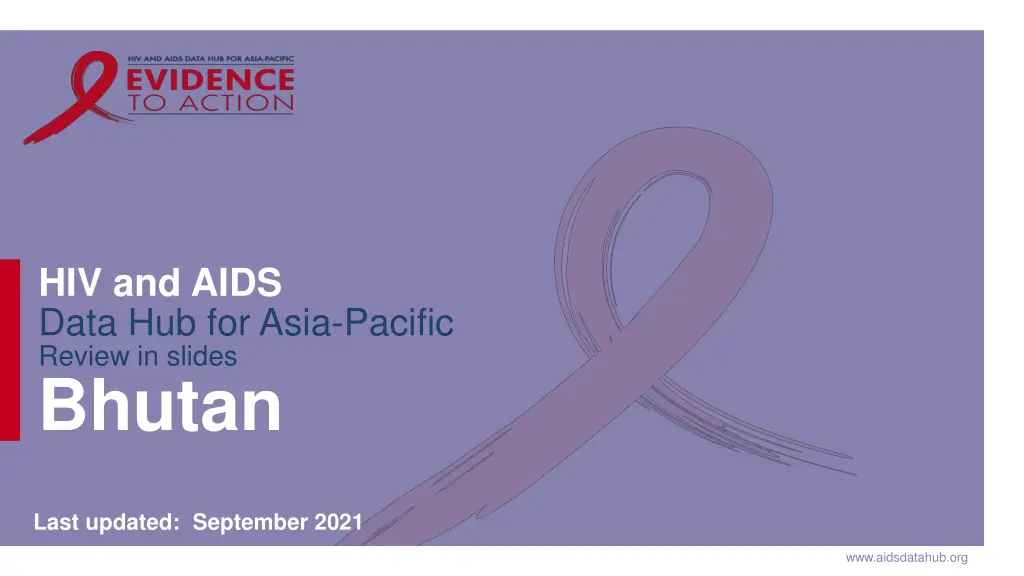
HIV and AIDS Data Hub for Asia-Pacific Review in slides Bhutan Last updated: September 2021 www.aidsdatahub.org
HIV and AIDS Data Hub for Asia-Pacific CONTENT Basic socio-demographic indicators HIV prevalence and epidemiology Risk behaviors Vulnerability and HIV knowledge HIV expenditure National response 2
HIV and AIDS Data Hub for Asia-Pacific BASIC SOCIO-DEMOGRAPHIC INDICATORS Total population (in thousands) Population aged 15-49 (thousands) Maternal mortality ratio (per 100 000 live births) Percentage of population in urban areas Antenatal care coverage - At least one visit (%) Crude birth rate (births per 1,000 population) Under-5 mortality rate (per 1,000 live births) Human development index (HDI) - Rank/Value Life expectancy at birth (years) - Male/Female Adult literacy rate (%) Ratio of girls to boys enrolled at primary level in public and private school (%) GDP per capita (PPP, current international $) Per capita total expenditure on health (PPP int. $) 775 (2015) 1 455 (2015)1 148 (2015)5 39 (2015) 2 97.9 (2012) 7 17.7 (2014) 2 33 (2015)2 132/0.605 (2014)4 70/70 (2015)5 53 (2005)2 1.01 (2014)2 8,077 (2015) 2 281 (2014)3 Sources: Prepared by www.aidsdatahub.org based on 1. UN Population Division. (2015). World Population Prospects: The 2015 Revision - Extended Dataset; 2. World Bank. World Data Bank: World Development Indicators & Global Development Finance. Retrieved July 2016, from http://data.worldbank.org/; 3. WHO. Global Health Observatory Indicator Views: Per Capita Total Expenditure on Health (PPP int. $) (Health Systems), Retrieved July 2016, from http://apps.who.int/gho/data/node.imr.WHS7_105?lang=en; 4. Palanivel, T., Mirza, T., Tiwari, B. N., Standley, S., & Nigam, A. (2016). Asia-Pacific Human Development Report - Shaping the Future: How Changing Demographics Can Power Human Development; 5. WHO. (2016). World Health Statistics 2016: Monitoring health for the SDGs; 6. World Bank Group. (2016). World Development Indicators 2016 and 7. UNSD. Millennium Development Goals Database - Antenatal Care Coverage Retrieved May 2016, from http://data.un.org/Data.aspx?q=Antenatal+care+coverage&d=MDG&f=seriesRowID%3a762.
HIV prevalence and epidemiology www.aidsdatahub.org
HIV and AIDS Data Hub for Asia-Pacific Estimated people living with HIV, new HIV infections and AIDS-related deaths, 1990-2020 3,500 3,000 2,500 Number 2,000 1,500 1 300 1,000 500 <100 <100 - 1991 1995 1999 2003 1990 1992 1993 1994 1996 1997 1998 2000 2001 2002 2004 2005 2006 2007 2008 2009 2010 2011 2012 2013 2014 2015 2016 2017 2018 2019 2020 PLHIV New HIV infections AIDS-related deaths 5 Source: Prepared by www.aidsdatahub.org based on UNAIDS. (2021). UNAIDS HIV estimates 1990-2020 and www.aidsinfo.unaids.org
HIV and AIDS Data Hub for Asia-Pacific Estimated people living with HIV, new HIV infections and AIDS-related deaths, 1990-2020 3,500 400 200 180 350 3,000 160 300 2,500 140 250 120 Number Number Number 2,000 200 100 1,500 80 1300 150 60 1,000 100 <100 40 <100 500 50 20 - - - 1990 1995 2000 2005 2010 2015 2020 2020 1990 1990 1995 2000 2005 2010 2015 1995 2000 2005 2010 2015 2020 PLHIV New HIV infections AIDS-related deaths 6 Source: Prepared by www.aidsdatahub.org based on UNAIDS. (2021). UNAIDS HIV estimates 1990-2020 and www.aidsinfo.unaids.org
HIV and AIDS Data Hub for Asia-Pacific Estimated number of adults (15+) living with HIV and women (15+) living with HIV, 1990-2020 3,500 3,000 2,500 Number 2,000 1,500 1 300 1,000 500 <500 - 2004 1990 1991 1992 1993 1994 1995 1996 1997 1998 1999 2000 2001 2002 2003 2005 2006 2007 2008 2009 2010 2011 2012 2013 2014 2015 2016 2017 2018 2019 2020 Adults (15+) living with HIV Women (15+) living with HIV 7 Source: Prepared by www.aidsdatahub.org based on UNAIDS. (2021). UNAIDS HIV estimates 1990-2020 and www.aidsinfo.unaids.org
HIV and AIDS Data Hub for Asia-Pacific Newly diagnosed and cumulative HIV cases in Bhutan, 1993-2018 Cumulative HIV cases by sex, 2018 Reported new HIV cases 70 57 60 50 40 627 Number 30 48% 52% cumulative HIV cases in 2018 20 10 2 0 1993 1994 1995 1996 1997 1998 1999 2000 2001 2002 2003 2004 2005 2006 2007 2008 2009 2010 2011 2012 2013 2014 2015 2016 2017 2018 Male Female Source: Prepared by www.aidsdatahub.org based on National HIV/AIDS and STI Prevention and Control Porgramme (NACP)
HIV and AIDS Data Hub for Asia-Pacific Annual reported number of HIV infections by gender, 2000-2014 Female Male 60 Number 50 40 29 28 22 30 15 13 15 20 16 14 13 12 23 8 22 22 10 20 19 1 17 3 13 13 12 11 6 8 7 3 6 2 1 0 9 Source: Prepared by www.aidsdatahub.org based on National AIDS Control Programme. (2015). Country Progress Report on the HIV Response in Bhutan-2015.
HIV and AIDS Data Hub for Asia-Pacific Number of cumulative HIV infections by age group and gender, 1993 2014 Number 140 120 51 100 56 80 60 41 81 40 17 56 20 29 16 4 10 4 21 6 6 4 1 0 <5 yr 5-14 yr 15-19 yr 20-24 yr 25-29 yr 30-39 yr 40-49 yr 50+ Male Female 10 Source: Prepared by www.aidsdatahub.org based on National AIDS Control Programme. (2015). Country Progress Report on the HIV Response in Bhutan-2015.
HIV and AIDS Data Hub for Asia-Pacific Proportion of cumulative HIV infections by mode of transmission, 1993 2014 1% 7% 1% Heterosexual Mother-to-child transmission Injecting drug use Blood transfusion 91% 11 Source: Prepared by www.aidsdatahub.org based on National AIDS Control Programme. (2015). Country Progress Report on the HIV Response in Bhutan-2015.
HIV and AIDS Data Hub for Asia-Pacific Proportion of cumulative HIV infections by site of detection, 1993 2014 Thimphu 73 Chukha 15 S/Jongkhar 194 22 Wangdue 26 Sarpang Other districts 73 12 Source: Prepared by www.aidsdatahub.org based on National AIDS Control Programme. (2015). Country Progress Report on the HIV Response in Bhutan-2015.
HIV and AIDS Data Hub for Asia-Pacific Syphilis and hepatitis B prevalence among surveyed populations, 2006-2011 Prevalence (%) 80 72 60 40 20 6.3 5.3 2.3 2 1 0 2006 2006 2011 2011 2006 2006 Female sex workers* Armed forces personnel ANC STI patients attendees Syphilis Hepatitis B *Phuentsholing Source: Prepared by www.aidsdatahub.org based on Royal Government of Bhutan (2008). National Strategic Plan for the Prevention and Control of STIs and HIV and AIDS; National STIs and HIV/AIDS Prevention and Control Programme. (2012). Bhutan Global AIDS Response Progress Report, 2012; and Royal Government of Bhutan (2012). Bhutan National Strategic Plan for the Prevention and Control of STIs and HIV/ AIDS (2012-2016), Kingdom of Bhutan, Thimphu 13
HIV and AIDS Data Hub for Asia-Pacific Sexually transmitted infections (STI) incidence per 10,000 population, 2008-2012 30 STI incidence per 10,000 population 26 25 20 19 17 15 12 10 10 5 0 2008 2009 2010 2011 2012 14 Source: Prepared by www.aidsdatahub.org based on Bhutan Health Management Information System, Ministry of Health, Royal Government of Bhutan. (2013). Annual Health Bulletin 2013.
Risk behaviours www.aidsdatahub.org
HIV and AIDS Data Hub for Asia-Pacific Proportion of key populations who reported condom use at last sex, 2008 Condom use (%) 100 80 60 54 38 40 20 0 People who use drugs Bar girls At last sex At last sex with new client 16 Source: Prepared by www.aidsdatahub.org based on National STIs and HIV/AIDS Prevention and Control Programme. (2012). Bhutan Global AIDS Response Progress Report, 2012.
HIV and AIDS Data Hub for Asia-Pacific Proportion of surveyed populations who reported condom use at last sex by partner type in the last year, 2008 With regular partners in last year With commerical partners in last year 100 % 80 60 100 97 91 84 82 82 40 73 71 67 64 61 60 60 53 52 43 20 38 35 0 Thimphu Thimphu Thimphu Thimphu Thimphu Mongar Phuentsholing Samdrup Jongkhar Samdrup Jongkhar Migrant workers Police Army Taxi drivers Truckers 17 Source: Prepared by www.aidsdatahub.org based on National AIDS/STI Control Programme Bhutan. (2009). Behavioural Surveillance Survey, 2008 Bhutan - Technical Report
HIV and AIDS Data Hub for Asia-Pacific Proportion of surveyed populations who reported transactional sex in the last year, 2008 100 % 80 60 40 66 54 20 40 39 30 26 26 22 21 14 13 0 Phuentsholing Mongar Thimphu Thimphu Samdrup Jongkhar Thimphu Thimphu Thimphu Samdrup Jongkhar Married Unmarried Migrant workers Police Army Taxi drivers Truckers Urban males 18 Source: Prepared by www.aidsdatahub.org based on National AIDS/STI Control Programme Bhutan. (2009). Behavioural Surveillance Survey, 2008 Bhutan - Technical Report
HIV and AIDS Data Hub for Asia-Pacific Proportion of surveyed populations who reported illicit drug use in the last year, 2008 Used illicit drugs last year Injected drugs last year % 100 80 60 40 19 19 16 14 13 20 8 7 4 4 2 1 1 1 0 0 0 0 0 0 0 0 0 0 Phuentsholing Phuentsholing Mongar Samdrup Jongkhar Thimphu Thimphu Thimphu Thimphu Thimphu Thimphu Samdrup Jongkhar Bar girls Migrant workers Police Army Taxi drivers Truckers 19 Source: Prepared by www.aidsdatahub.org based on National AIDS/STI Control Programme Bhutan. (2009). Behavioural Surveillance Survey, 2008 Bhutan - Technical Report
HIV and AIDS Data Hub for Asia-Pacific Proportion of surveyed population who reported the use of a condom with extramarital and premarital partners in the past 12 months, 2006 % 100 84 76 80 73 73 64 Extramarital sex 60 44 40 Premarital sex 20 0 Total Male Female Total Total Total Urban Rural 20 Source: Prepared by www.aidsdatahub.org based on General Population Survey (GPS), 2006 cited in World Bank. (2008). HIV/AIDS in Bhutan.
HIV and AIDS Data Hub for Asia-Pacific Proportion of women who reported condom use by age group and partner type, 2010 % 100 80 62 60 Condom use during sex with multiple partners 40 21 Condom use during sex with non-regular partners 20 0 15-49 yr 15-24 yr 21 Source: Prepared by www.aidsdatahub.org National Statistics Bureau, UNICEF, & UNFPA. (2011). Bhutan Multiple Indicator Survey 2010.
HIV and AIDS Data Hub for Asia-Pacific Reported sexual behaviors among surveyed adolescents (13-18 yr), 2009 0% 20% 40% 60% 80% 100% Had sex with non-regular, non paid partner 5 93 2 Female 2+ times Had sex in exchange for money 7 88 5 Once Never Had sex with non-regular, non paid partner 23 33 45 Male Had sex in exchange for money 14 14 73 Source: Prepared by www.aidsdatahub.org based on Department of Youth and Sports, Ministry of Education. (2011). An Assessment of Vulnerable and At-risk Adolescents (13-18 years) in Bhutan: Exploring Social & Health Risk Behaviours. 22
Vulnerability and HIV knowledge www.aidsdatahub.org
HIV and AIDS Data Hub for Asia-Pacific Proportion of surveyed populations with comprehensive HIV knowledge, 2008 100 % 80 60 39 38 34 32 32 32 40 17 15 14 20 8 5 5 0 Phuentsholing Phuentsholing Mongar Thimphu Thimphu Thimphu Thimphu Thimphu Samdrup Jongkhar Thimphu Thimphu Samdrup Jongkhar Bar girls Drug users Migrant workers Police Army Taxi drivers Truckers 24 Source: Prepared by www.aidsdatahub.org based on National AIDS/STI Control Programme Bhutan. (2009). Behavioural Surveillance Survey, 2008 Bhutan - Technical Report
HIV and AIDS Data Hub for Asia-Pacific Proportion of surveyed women with comprehensive HIV knowledge, 2010 Comprehensive knowledge (%) 100 80 60 46 36 40 30 25 23 20 21 18 13 14 15 15 15 16 20 11 9 9 8 6 6 5 0 25 Source: Prepared by www.aidsdatahub.org National Statistics Bureau, UNICEF, & UNFPA. (2011). Bhutan Multiple Indicator Survey 2010.
HIV and AIDS Data Hub for Asia-Pacific Proportion of young people with misconceptions on HIV transmission and treatment, 2006 100 % 76 80 69 60 48 40 20 0 HIV can be transmitted by mosquito bites HIV/AIDS is curable if treated early PLHIV should be isolated to avoid spreading the risk of infection 26 Source: Prepared by www.aidsdatahub.org based on WHO. (2006). Fact Sheet on Young People and HIV/AIDS in Bhutan.
HIV Expenditure www.aidsdatahub.org
National response www.aidsdatahub.org
HIV and AIDS Data Hub for Asia-Pacific Proportion of surveyed populations who have ever tested for HIV, Thimphu, 2008 100 HIV testing (%) 90 80 70 57 60 50 42 39 40 28 26 25 30 20 12 10 0 Drug users Bar girls Migrant workers Army Police Taxi drivers Truckers 29 Source: Prepared by www.aidsdatahub.org based on National AIDS/STI Control Programme Bhutan. (2009). Behavioural Surveillance Survey, 2008 Bhutan - Technical Report
HIV and AIDS Data Hub for Asia-Pacific Treatment cascade, 2020 1 300 1400 1200 Number of people 1000 741 800 598 600 400 200 60 39 0 Estimated PLHIV PLHIV know their People on ART PLHIV tested for viral load PLHIV who have suppressed viral load * status * Number of people on ART who received a viral load test in the past year and have VL of <1000copies/ml 30 Source: Prepared by www.aidsdatahub.org based on UNAIDS. (2021). UNAIDS HIV estimates 1990-2020 and Global AIDS Monitoring
HIV and AIDS Data Hub for Asia-Pacific HIV testing and treatment cascade, 2020 100 % 90 81 80 73 60 40 20 56 45 na 0 PLHIV who their status PLHIV on treatment PLHIV who have suppressed viral load Progress (%) Gap Target 31 Source: Prepared by www.aidsdatahub.org based on UNAIDS. (2021). UNAIDS HIV estimates 1990-2020
HIV and AIDS Data Hub for Asia-Pacific Number of ART sites and number of people on ART, 2004 - 2020 700 10 598 600 8 500 # peopleon ART # ART sites 6 400 5 5 300 4 200 2 100 0 0 Number of health facilities that offer ART Number of people on ART 32 Source: Prepared by www.aidsdatahub.org based on 1.UNAIDS. (2021). UNAIDS HIV Estimates 1990 2020; 2. National AIDS Control Programme. (2015). Country Progress Report on the HIV Response in Bhutan- 2015; and 3. Bhutan Global AIDS Response Progress Reporting, and Global AIDS Monitoring
HIV and AIDS Data Hub for Asia-Pacific ART scale-up, 2004 - 2020 700 100 598 600 80 ART coverage (%) 500 60 Number 400 300 40 200 20 100 45 0 0 % PLHIV on ART Number of people on ART 33 Source: Prepared by www.aidsdatahub.org based on UNAIDS. (2021). UNAIDS HIV estimates 1990-2020
HIV and AIDS Data Hub for Asia-Pacific Estimated adults living with HIV, adults receiving ARVs, and adult ART coverage, 2020 3,500 100 3,000 80 ART coverage (%) 2,500 60 Number 2,000 44 1,500 40 1,000 20 567 500 1 300 - 0 Estimated number of adults 15+ living with HIV Number of adults receiving ART ART coverage (%) 34 Source: Prepared by www.aidsdatahub.org based on UNAIDS. (2021). UNAIDS HIV estimates 1990-2020
HIV and AIDS Data Hub for Asia-Pacific PMTCT cascade, 2020 10 100% 9 8 7 6 Number 5 9 4 3 2 1 na na na 0 0% Estimated pregnant women living with HIV Pregnant women receiving ART to prevent vertical transmission Infants receiving a virological test for HIV within 2 months of birth New child infections 35 Source: Prepared by www.aidsdatahub.org based on UNAIDS. (2021). UNAIDS HIV estimates 1990-2020 and Global AIDS Monitoring (GAM)
HIV and AIDS Data Hub for Asia-Pacific National data on stigma & discrimination Selected indicators of response from NCPI 2014 Access to justice: Legal services (legal aid or other) NHRI or other mechanisms Civil society perspectives/ratings: Laws and policies in place to protect and promote HIV- related human rights 2009 N/A 2011 2013 Trend 5/10 3/10 Efforts to implement human rights-related laws and policies N/A 3/10 6/10 STIGMA INDEX Percent of PLHIV respondents who avoided going to a local clinic when needed because of HIV status: No Stigma Index Source: Prepared by UNAIDS Regional Support Team Asia and the Pacific and www.aidsdatahub.org based on information provided by UNAIDS country office and partners
HIV and AIDS Data Hub for Asia-Pacific Punitive and discriminatory laws, 2021 Laws or policies restricting the entry, stay and residence of people living with HIV Law allows for possession of a certain limited amount of drugs for personal use Parental consent for adolescents to access HIV testing Criminalization of same-sex sexual acts Criminalization of TG people Criminalization of sex work NO NO NO YES YES NO INFORMATION AVAILABLE INFORMATION AVAILABLE Sources: Prepared by www.aidsdatahub.org based on UNAIDS. (2021). Global AIDS Update 2021. Confronting Inequalities: Lessons for pandemic responses from 40 years of AIDS.
HIV and AIDS Data Hub for Asia-Pacific THANK YOU slides compiled by www.aidsdatahub.org Data shown in this slide set are comprehensive to the extent they are available from country reports. Please inform us if you know of sources where more recent data can be used. Please acknowledge www.aidsdatahub.org if slides are lifted directly from this site 38

