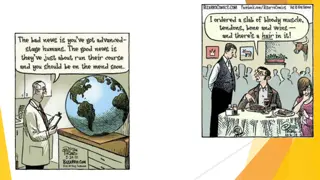
Asking Better Questions
In this presentation, data on various aspects of student success at CSUB is showcased through detailed images covering topics such as new student profiles, Pell eligibility, remedial status, academic performance, and more. The visuals provide insights into student demographics, performance indicators, and success metrics aimed at enhancing educational outcomes at the institution.

Download Presentation

Please find below an Image/Link to download the presentation.
The content on the website is provided AS IS for your information and personal use only. It may not be sold, licensed, or shared on other websites without obtaining consent from the author.If you encounter any issues during the download, it is possible that the publisher has removed the file from their server.
You are allowed to download the files provided on this website for personal or commercial use, subject to the condition that they are used lawfully. All files are the property of their respective owners.
The content on the website is provided AS IS for your information and personal use only. It may not be sold, licensed, or shared on other websites without obtaining consent from the author.
E N D
Presentation Transcript
Asking Better Questions Data Presentation on Student Success at CSUB Kris Krishnan, Ed.D Vikash Lakhani
Pell Eligibility First-Time Freshmen Non-Pell Pell
1stGeneration Status First-Time Freshmen Data not Available First Generation Non-First Generation
Remedial Status First-Time Freshmen Both English Math None
Average HS GPA- - First-Time Freshmen
Race/Ethnicity First-Time Freshmen American Indian or Alaskan Native Asian Black or African American Hispanic/Latino Native Hawaiian or Other Pacific Islander Non-Resident Alien Two or More Races Unknown White
Student Attrition Who leaves? When do they leave? Where do they go?
Attrition First-Time Freshmen Fall 2004 Fall 2005 Fall 2006 Fall 2007 Fall 2008 Fall 2009 Fall 2010 Fall 2011 Fall 2012 Fall 2013 Fall 2014 Fall 2015 20.9% 23.5% 27.3% 26.5% 26.4% 32.2% 35.0% 39.4% 43.0% 42.5% 40.0% 45.8% 41.5% 43.9% 49.8% 50.3% 46.9% 49.5% 42.3% 46.5% 50.3% 48.1% 44.4% 50.9% 43.9% 47.1% 51.9% 47.7% 48.0% 51.1% 46.5% 46.8% 50.8% 50.5% 49.4% 52.3% After 1YR After 2YR After 3YR After 4YR After 5YR After 6YR 28.7% 41.6% 46.0% 46.1% 46.5% 28.0% 39.7% 44.5% 45.7% 25.5% 37.9% 42.6% 26.8% 40.1% 23.4%
American Indian or Alaskan Native Asian Black or African American Hispanic/Latino Native Hawaiian or Other Pacific Islander Non-Resident Alien Two or More Races Unknown White
Questions What role can faculty play in student success? What do faculty need to help in student success? What role can technology play in our efforts to improve student success? What criteria do we use to determine at-risk students? Who intervenes and when? What resources do we have for students at-risk? How do we improve success rates for students entering needing remediation?
Student Success Forum Table Number Table Topic College readiness (remediation) 1 Academic Advising (Faculty and Staff) 2 Student Affairs/Engagement 3 Progress to Degree 4 Data 5 Student Support Programs 6 College Access 7 Pro-active intervention (At-Risk, Early Warning, etc.) 8 Technology 9 Faculty Intervention of At-Risk Students (General Education/FYS) 10 Clear and Accurate Academic Roadmaps 11 High Impact Practices 12 Curriculum streamlining (removing barriers) 13 Assessment/University Learning Outcomes 14 Business Operations/Facilities/Safety 15 University Advancement/Alumni 16
Discussion Questions How would addressing (table topic) help CSUB improve on its 4-year and 6-year graduation rates? What are our strengths/challenges around (table topic)? What sort of data is available/needed around (table topic)? Who or what areas on-campus and off-campus do we need to collaborate with to strengthen our efforts around (table topic)? What top 2 steps can we take in 2016/2017 to address (table topic)? What top 2 steps can we take in the long term to address (table topic)? General question: What does Student Success mean to you as a group? (pick top 3 words/statements) Instructions For Discussions: Select a table facilitator (if one hasn t been assigned to you) 1. Select a note-taker 2. Use discussion questions provided at the table to guide discussions 3. Use flip-chart paper provided to record your thoughts around the discussion questions 4. For Report-Out: Identify 3-5 major take-aways from your group and write them on the post-it note(s) provided 1. Identify top 3 words/statements that define Student Success for your group and write them on the post-it note(s) provided 2. Place the post-it note on the flip-chart paper arranged at the front of the room/on the wall 3.


 – First-Time Freshmen")