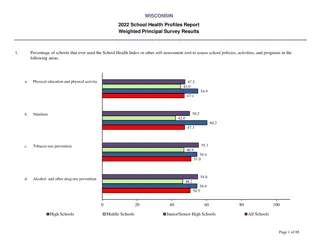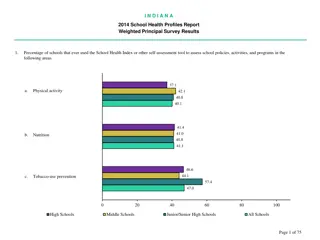
Assessing Health and Safety Performance in Shiftwork Operations - Insights and Data
Explore insights and data on assessing health and safety performance in shiftwork operations, presented at the Australian Sugar Manufacturers Industry Safety Conference. Learn about shiftwork solutions, experiences, methodologies, shiftwork statistics in Australia, worker assessments, industry representation, roster performance indicators, worker feedback, and employee demographics working in shift schedules.

Download Presentation

Please find below an Image/Link to download the presentation.
The content on the website is provided AS IS for your information and personal use only. It may not be sold, licensed, or shared on other websites without obtaining consent from the author. If you encounter any issues during the download, it is possible that the publisher has removed the file from their server.
You are allowed to download the files provided on this website for personal or commercial use, subject to the condition that they are used lawfully. All files are the property of their respective owners.
The content on the website is provided AS IS for your information and personal use only. It may not be sold, licensed, or shared on other websites without obtaining consent from the author.
E N D
Presentation Transcript
ASSESSING HEALTH AND SAFETY PERFORMANCE IN SHIFTWORK OPERATIONS Tuesday, 25th March 2025 Australian Sugar Manufacturers Industry Safety Conference
SHIFTWORK SOLUTIONS
OUR METHODOLOGY Business needs Health and safety needs ROSTER Employee needs
SHIFTWORK OPERATIONS
SHIFTWORK IN AUSTRALIA HOW MANY? RISK? WHEN? Cardiovascular Disease, Diabetes, Sleep, Health Habits Approx 1.4 million 16% of total workforce ABS Afternoon, Night, Saturday, Sunday, Public Holiday shifts
SHIFT WORKER ASSESSMENT DATABASE 40,372 individual workers 84 percent average response rate Small group meetings 355 different operating sites Confidential shiftwork questionnaires 221 different organisations
SHIFTWORK INDUSTRIES REPRESENTED 1,577 from energy and utilities 10,846 from manufacturing 1,353 from processing plants 11,479 from services 15,117 from mining
ROSTER PERFORMANCE INDICATORS HEALTH AND SAFETY Absenteeism Productivity Operating costs Turnover Safety performance Overtime Employee satisfaction
SHIFT WORKER FEEDBACK
YEARS WORKING SHIFTWORK AGE OF EMPLOYEES Percent (%) Percent (%) 30 28 27 21 19 19 19 17 12 4 3 1 Nil (Day Worker) 0 - 5 yrs 6 - 10 yrs 11 - 15 yrs 16 - 20 yrs 21 yrs or more Less than 20 yrs 20 - 29 yrs 30 - 39 yrs 40 - 49 yrs 50 - 59 yrs 60 yrs or more
COMMUTE TIMES (ONE WAY) SHARE A LIFT TO WORK 81 Percent (%) Percent (%) 36 30 19 19 10 5 0-15 min 16-30 min 31-45 min 46-60 min > 60 min Yes No
SPOUSE/PARTNER WORK OUTSIDE HOME CHILDREN REQUIRING CARE 77 Percent (%) Percent (%) 46 40 23 14 Yes, Yes, No Yes No Day work Shiftwork
SLEEP PATTERNS IDEAL SLEEP RANGE (7 9 HRS) 7.7 6.7 6.6 5.9 Hours of Sleep Day Shift Afternoon Shift Night shift Days Off Caffeine (Cups/day) 3.3 2.9 2.5 3.2
PROBLEM WITH POOR QUALITY SLEEP 33 Percent (%) 27 25 10 5 None Slight Moderate Fairly Significant Significant
OBSERVED POOR PERFORMANCE/ POOR SAFETY PRACTICES Percent (%) 41 22 21 5 11 Yes, mostly on day shift Yes, mostly on afternoon shift Yes, mostly on night shift Yes, on all shifts No
EMPLOYEE HEALTH HABITS Healthy weight for height Eat breakfast, Good diet Sleep 7hr - 8hr a day Non-Smoker & Non-Vaper Regular exercise <2 Alcoholic drinks a day Average number of health habits followed: Day worker benchmark Shiftworker benchmark 4.1 3.7
CURRENT ROSTER SATISFACTION 37 Percent (%) 26 12 10 8 7 Very Satisfied Moderately Satisfied Slightly Satisfied Slightly Dissatisfied Moderately Dissatisfied Very Dissatisfied
JOB SATISFACTION 40 34 Percent (%) 12 6 4 4 Very Satisfied Moderately Satisfied Slightly Satisfied Slightly Dissatisfied Moderately Dissatisfied Very Dissatisfied
BETTER ROSTERS THAN CURRENT? 65 Percent (%) 35 Yes No
REASONS FOR CURRENT ROSTER DISSATISFACTION 35 Not enough total days off 41 Inadequate quality time off 32 Interferes with family and social life 24 No predictability 37 Restricts effective work-related training Percent (%)
PREFERRED SHIFT LENGTH 43 Percent (%) 23 23 8 3 8 hour shifts 1.8 days off 9 hour shifts 2.3 days off 10 hour shifts 2.8 days off 11 hour shifts 3.2 days off 12 hour shift 3.5 days off
LENGTH OF WORK CYCLES 73 Percent (%) 27 Prefer longer work cycles & longer breaks Prefer shorter work cycles & shorter breaks
PREFERRED SHIFT START AND FINISH TIMES 8 Hour Shifts 28 Percent (%) 25 14 8 7 7 4 4 2 Earlier than 5:00am, 1:00pm & 9:00pm 5:00am, 1:00pm & 9:00pm 5:30am, 1:30pm & 9:30pm 6:00am, 2:00pm & 10:00pm 6:30am, 2:30pm & 10:30pm 7:00am, 3:00pm & 11:00pm 7:30am, 3:30pm & 11:30pm 8:00am, 4:00pm & Midnight Later than 8:00am, 4:00pm & Midnight
HOW MUCH OVERTIME ARE YOU WORKING? DO YOU DEPEND ON OVERTIME FOR PERSONAL FINANCES? Too Much 18% No 73% Yes 27% Not Enough 18% Just Right 64%
PREFERRED WORK HOURS PER WEEK 17 Percent (%) 15 14 13 12 10 6 5 5 3 35 hours or less 36-37 hours 38-39 hours 40-41 hours 42-43 hours 44-45 hours 46-50 hours 51-55 hours 56-59 hours 60 or more hours
ROTATING OR PERMANENT SHIFTS 59 Percent (%) 41 Rotating Shifts Permanent Shifts
PREFERRED SHIFT ROTATION 34 31 Percent (%) 17 7 6 3 2 Less than 1 week 1 week & rotate 2 weeks & rotate 3 weeks & rotate 4 weeks & rotate 8 weeks & rotate 12 weeks or more & rotate
WHICH WOULD YOU PREFER TO WORK? 54 Percent (%) 24 22 Work partial weekends & have partial weekends off Work whole weekends & have whole weekends off Never work weekends
CONSIDERED CHANGING CURRENT EMPLOYMENT? 51 Percent (%) 14 13 11 11 No Yes, to get a better roster Yes, for family/ personal reasons Yes, to get better pay Yes, to get a better job
SINGLE MOST DESIRED BENEFIT Overtime Opportunities 13% Days Off 33% Benchmark Database Health & Alertness 39% Predictability 15%
WILLINGNESS FOR A 6 - 12 MONTH TRIAL 46 Percent (%) 30 24 Yes Maybe No
OPINION OF ROSTER REVIEW PROGRAM Percent (%) 48 40 12 Positive Neutral Negative
ROSTERS and HOURS of WORK
1994 ROSTER 7 day, 8-hour shift roster for continuous operation Roster Hours Crew Week M T W T F S S A 1 - d d d d d d 48 B 2 d - - a a a a 40 C 3 a a a - - n n 40 D 4 n n n n n - - 40 273 rostered shifts and 91 rostered days off per year
SINGLE MOST DESIRED BENEFIT 1994 Overtime Opportunities 9% Days Off 51% Health & Alertness 28% Benchmark Database Predictability 12%
2024 ROSTER 7 day, 12-hour shift roster for continuous operation Roster Hours Crew Week M T W T F S S A 1 D D N N - - - 48 B 2 - - D D N N N 60 C 3 - - - - D D D 36 D 4 N N - - - - - 24 182 rostered shifts and 182 rostered days off per year
FATIGUE MANAGEMENT GUIDELINES
FATIGUE GUIDELINES Provide useful information for managing fatigue Require understanding and interpretation Preventing and managing fatigue-related risk in the workplace Workplace Health and Safety Queensland, July 2020 Fatigue Factors Checklist Is a forward rotation shift system in place (e.g. morning to afternoon, afternoon to night)?
CLOCKWISE (FORWARD) ROSTER ROTATION Day (Morning) to Afternoon to Night Shift Rotation Roster Hours Crew Week M T W T F S S A 1 - d d d d d d 48 B 2 d - - a a a a 40 C 3 a a a - - n n 40 D 4 n n n n n - - 40
ANTI-CLOCKWISE (BACKWARD) ROSTER ROTATION Day (Morning) to Night to Afternoon Shift Rotation Roster Hours Crew Week M T W T F S S A 1 - a a a a a a 48 B 2 a - - d d d d 40 C 3 d d d - - n n 40 D 4 n n n n n - - 40
IN SUMMARY - ACHIEVING AN ACCEPTABLE LEVEL OF RISK Analyse site-specific business, employee and health/safety requirements for hours of work Optimise roster design by work area Implement control measures to eliminate or reduce fatigue related risks


")


 ROSTER ROTATION")
 ROSTER ROTATION")