Assessment Literacy: Validity, Quality, and Consequences
Delve into the realm of assessment literacy to grasp the significance of validity, threats to quality, and the meanings and consequences of assessment results. Explore the evolution of validity concepts, challenges to assessment quality, and the social impacts of assessment practices in education. Gain insights into interpreting assessment outcomes and making informed decisions based on empirical evidence.
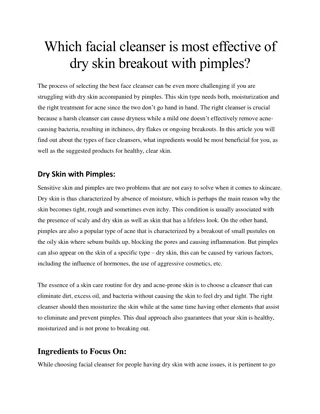
Download Presentation

Please find below an Image/Link to download the presentation.
The content on the website is provided AS IS for your information and personal use only. It may not be sold, licensed, or shared on other websites without obtaining consent from the author. If you encounter any issues during the download, it is possible that the publisher has removed the file from their server.
You are allowed to download the files provided on this website for personal or commercial use, subject to the condition that they are used lawfully. All files are the property of their respective owners.
The content on the website is provided AS IS for your information and personal use only. It may not be sold, licensed, or shared on other websites without obtaining consent from the author.
E N D
Presentation Transcript
What is an assessment? 2 An assessment is a procedure for making inferences We give students things to do We collect the evidence We draw conclusions Key question: Once you know the assessment outcome, what do you know? For any test: some inferences are warranted (valid) some are not
Validity 3 Evolution of the idea of validity A property of a test A property of students scores on a test A property of inferences drawn on the basis of test results One validates not a test but an interpretation of data arising from a specified procedure (Cronbach, 1971) Consequences No such thing as a valid (or indeed invalid) assessment No such thing as a biased assessment Formative and summative are descriptions of inferences
Quality in assessment Threats to validity Construct-irrelevant variance Systematic: good performance on the assessment requires abilities not related to the construct of interest Random: good performance is related to chance factors, such as luck (effectively poor reliability) Construct under-representation Good performance on the assessment can be achieved without demonstrating all aspects of the construct of interest
Meanings and consequences of assessment Evidential basis What does the assessment result mean? Consequential basis What does the assessment result do? Assessment literacy (Stiggins, 1991) Do you know what this assessment result means? Does it have utility for its intended use? What message does this assessment send to students (and other stakeholders) about the achievement outcomes we value? What is likely to be the effect of this assessment on students?
Validity revisited Validity is an integrative evaluative judgment of the degree to which empirical evidence and theoretical rationales support the adequacy and appropriateness of inferences and actions based on test scores or other modes of assessment. (Messick, 1989 p. 13) Social consequences: Right concern, wrong concept (Popham, 1997) No such thing as consequential validity
7 Understanding reliability
Understanding test scores Consider a test of students ability to spell words drawn from a bank of 100 words. What we can conclude depends on: The size of the sample The way the sample was drawn Students knowledge of the sample The amount of notice given
Reliability and sample size 9 What can you conclude about a student who: correctly spelled 1 out of 2 words correctly spelled 5 out of 10 words correctly spelled 10 out of 20 words correctly spelled 50 out of 100 words? If you re sampling, conclusions about the unsampled items will be subject to error Assessment literacy requires knowing how big the error is
The standard error of measurement The standard error of measurement (SEM) is just the standard deviation of the errors, so, on any given testing occasion 68% of students score within 1 SEM of their true score 96% of students score within 2 SEM of their true score
Relationship of reliability and error For a typical test (average score 70, standard deviation 15), a student who should have scored 70 will actually score: Reliability SEM Two-thirds of the time (68%) Almost always (96%) 0.70 8.2 62 to 78 54 to 86 0.75 7.5 6.7 63 to 78 63 to 77 55 to 85 57 to 83 0.80 0.85 5.8 64 to 76 58 to 82 0.90 0.95 4.7 3.4 65 to 75 67 to 73 61 to 79 63 to 77
Reliability: 0.75 100 90 80 70 Observed score 60 50 40 30 20 10 0 0 10 20 30 40 50 60 70 80 90 100 True score
Reliability: 0.80 100 90 80 70 Observed score 60 50 40 30 20 10 0 0 10 20 30 40 50 60 70 80 90 100 True score
Reliability: 0.85 100 90 80 70 Observed score 60 50 40 30 20 10 0 0 10 20 30 40 50 60 70 80 90 100 True score
Reliability: 0.90 100 90 80 70 Observed score 60 50 40 30 20 10 0 0 10 20 30 40 50 60 70 80 90 100 True score
Reliability: 0.95 100 90 80 70 Observed score 60 50 40 30 20 10 0 0 10 20 30 40 50 60 70 80 90 100 True score
17 Understanding what this means in practice
18 Grouping students by ability
Using tests for grouping students by ability Using a test with a reliability of 0.9, and with a predictive validity of 0.7, to group 100 students into four ability groups: should be in group 1 group 2 group 3 group 4 group 1 23 9 3 group 2 9 12 6 3 students placed in group 3 3 6 7 4 group 4 3 4 8 Only 50% of the students are in the right group
20 Diagnostic testing
The limits of diagnostic testing 120-item multiple choice test for teacher licensure Four major subject areas language arts/reading mathematics social studies science 30 items per subject area Sub-score reliabilities range from 0.71 to 0.83
How reliable are 10-item subtest scores? Items for each subject area ranked in order of difficulty (i.e., 1 to 30) Three parallel 10-item forms created in each subject area: Form A: items 1, 4, 7, 28 Form B: items 2, 5, 8, 29 Form C: items 3, 6, 9, 30 Sub-score reliabilities in the range 0.40 to 0.60 On form A, 271 examinees scored 7 in mathematics and 3 in science
Scores of 271 students on form B Science subscore 1 0 2 0 3 0 4 1 5 1 6 1 7 0 8 0 9 0 10 0 1 2 0 0 0 1 3 1 2 0 0 0 3 1 0 0 1 2 4 3 1 1 1 Math subscore 4 0 0 2 7 7 6 4 0 1 0 5 0 1 1 1 10 14 8 5 1 1 6 2 0 1 5 10 11 15 8 1 1 110 out of 271 (41%) examinees got a better form B score in science 7 0 1 4 4 4 11 10 7 4 0 8 0 1 1 5 12 13 7 5 4 0 9 0 than mathematics 0 1 1 6 3 7 4 3 0 10 0 0 0 1 1 2 1 1 0 0 Sinharay, Gautam and Halberman (2010)
What does this mean? A student scoring 7 on mathematics and 3 on science would probably want to improve the latter But 110 of the 271 examinees got a better score in science than mathematics on Form B Correlation of science subscores on Forms A and B is 0.48 Correlation of science subscore on Form A with total score on Form B is 0.63 In other words, the total score on a test is a better guide to the score on a sub-test than another score on the same sub-test!
25 Measuring progress
Reliability, standard errors, and progress Grade Reliability SEM as a percentage of annual progress 1 0.89 26% 2 0.85 56% 3 0.82 76% 4 0.83 39% 5 0.83 55% 6 0.89 46% Average 0.85 49% In other words, the standard error of measurement of this reading test is equal to six months progress by a typical student
Fortunately While progress measures for individuals are rather unreliable, progress measures for groups are much more reliable. The standard error for the average score of a group of individuals is the standard error for individuals, divided by the square root of the group size, so if the standard error of individual progress is 10 marks the standard error for the average progress of a class of 25 is just 2 marks
If you must measure progress As rules of thumb: For individual students, progress measures are meaningful only if the progress is more than twice the standard error of measurement of the test being used to measure progress For a class of 25 students, progress measures are meaningful if the progress is more than half the standard error of measurement of the test being used to measure progress.
Sylvie and Bruno concluded (Carroll, 1893) 30 That s another thing we ve learned from your Nation, said Mein Herr, map-making. But we ve carried it much further than you. What do you consider the largest map that would be really useful? About six inches to the mile. Only six inches! exclaimed Mein Herr. We very soon got to six yards to the mile. Then we tried a hundred yards to the mile. And then came the grandest idea of all! We actually made a map of the country, on the scale of a mile to the mile! Have you used it much? I enquired. It has never been spread out, yet, said Mein Herr: the farmers objected: they said it would cover the whole country, and shut out the sunlight! So we now use the country itself, as its own map, and I assure you it does nearly as well.
What is a grade? an inadequate report of an inaccurate judgment by a biased and variable judge of the extent to which a student has attained an undefined level of mastery of an unknown proportion of an indefinite material. (Dressel, quoted in Chickering, 1983 p. 12)
Scores versus grades 33 Precision is not the same as accuracy The more precise the score, the lower the accuracy. Less precise scores are more accurate, but less useful Scores suffer from spurious precision Given that no score is perfectly reliable, small differences in scores are unlikely to be meaningful Grades suffer from spurious accuracy When we use grades or categories, we tend to regard performance in different categories as qualitatively different
Meanings and consequences of school grades 34 Two rationales for grading Meanings Assessment as evidentiary reasoning Assessment outcomes as supports for making inferences (e.g., about student achievement) Consequences Assessment outcomes as rewards and punishments Assessments create incentives for students to do what we want them to do These two rationales interact, and conflict achievement grades for completion of homework achievement grades for effort penalties for late submission zeroes for missing work
Conclusions Validity is a property of inferences, not assessments Threats to validity: Construct under-representation (assessment too small ) Construct-irrelevant variance (assessment too big ) Systematic Random (unreliability) Test scores are unreliable (and that s a good thing) Change scores are even less reliable Diagnostic analysis of test scores is mostly useless All test users need to understand these issues

