Association Between Calcium Intake and Coronary Artery Calcification in Middle-Aged and Older Adults
A cross-sectional, multi-center study conducted on 5561 older adults revealed an inverse, non-linear association between calcium intake and coronary artery calcification (CAC). The study indicates that calcium supplements may contribute to increased CAC, especially in women. While calcium intakes in the middle quintiles seem adequate for bone health, excessive intake in the highest quintile could lead to greater CAC. The research findings emphasize the importance of understanding the relationship between calcium intake and cardiovascular health in aging populations.
Download Presentation

Please find below an Image/Link to download the presentation.
The content on the website is provided AS IS for your information and personal use only. It may not be sold, licensed, or shared on other websites without obtaining consent from the author.If you encounter any issues during the download, it is possible that the publisher has removed the file from their server.
You are allowed to download the files provided on this website for personal or commercial use, subject to the condition that they are used lawfully. All files are the property of their respective owners.
The content on the website is provided AS IS for your information and personal use only. It may not be sold, licensed, or shared on other websites without obtaining consent from the author.
E N D
Presentation Transcript
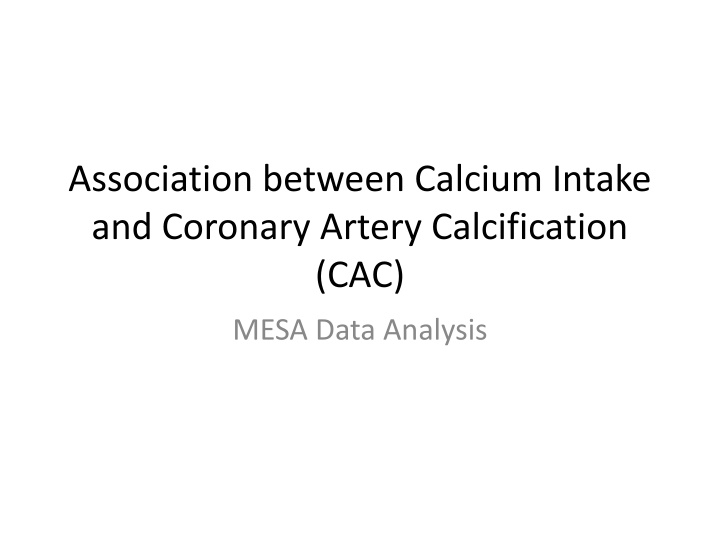
Association between Calcium Intake and Coronary Artery Calcification (CAC) MESA Data Analysis
Cross-sectional, Multi-Center Study of Older Adults (45 to 85 Years) Six US communities and 4 ethnic groups 5561 adults (51.7% female) with no CVD Dx CAC measured by CT (2 different machines) Quintiles: median total calcium intakes, mg/d : Q1 300 Q2 530 Q3 790 Q4 1205 Q5 2100
Major Finding, though Statistically Weak An inverse, non-linear association is found between calcium intake and CAC in middle-aged and older adults in cross-sectional analysis. Calcium supplements contribute, especially in women. Why the lowest calcium consumers (Q1) should have a high CAC (set at 1.0) is not readily apparent. Calcium intakes of the middle quintiles (2-4) seem to be sufficient for bone health, but not excessive for CAC. Calcium intakes of Q5 appear to be excessive and may contribute to greater CAC. Supplement intake is high.
Table 2C. Male Total Calcium Intake by Quintile: Diet & Supplemental Calcium Quintile of Calcium Intake Number % Supplement Users Mean Dietary Calcium Mean Mean Total Calcium Supplementary Calcium Q1 546 12% 291 mg/day [SD=79] 12 mg/day [SD=41] 303 mg/day [SD=78] Q2 608 27% 488 mg/day [SD=91] 42 mg/day [SD=78] 530 mg/day [SD=61] Q3 617 43% 687 mg/day [SD=142] 92 mg/day [SD=134] 779 mg/day [SD=85] Q4 541 48% 973 mg/day [SD=291] 189 mg/day [SD=275] 1162 mg/day [SD=150] Q5 371 58% 1563 mg/day [SD=786] 580 mg/day [SD=786] 2173 mg/day [SD=687]
Table 3. Fully Adjusted Relative Risk Regression Model Predicting CAC >0 Calcium Intake Quintile Median Ca Intake Risk Relative 95% Confidence Limits_______________________ P Value Q1 < 424 mg 300 1.00 Reference ---- Q2 424 to 639 mg 530 0.94 0.87 to 1.01 0.1046 Q3 640 to939 mg 790 0.92 0.85 to 0.997 0.0249 Q4 940 to 1472 mg 1205 0.89 0.82 to 0.97 0.0063 Q5 > 1473 mg _______________________________________________________________________ * Adjusted for age, gender, study site, BMI, exercise, smoking. Alcohol use, systolic BP, anti- hypertensive drug use, total cholesterol-to-HDL cholesterol ratio, lipid-lowering drug use, diabetes drug use, family history of MI, aspirin use, GFR, and serum homocysteine. 2100 0.92 0.85 to 1.01 0.0689
Table 4. Fully Adjusted Relative Risk Regression Model Predicting CAC >0: Further adjustment for socio- economic variables and energy intake Calcium Intake Quintile Median Ca Intake Risk Relative 95% Confidence Limits_______________________ P Value Q1 < 424 mg 300 1.00 Reference ---- Q2 424 to 639 mg 530 0.95 0.85 to 1.05 0.3211 Q3 640 to939 mg 790 1.01 0.90 to 1.13 0.9229 Q4 940 to 1472 mg 1205 0.92 0.82 to 0.9997 0.0493 Q5 > 1473 mg _______________________________________________________________________ * Adjusted for age, gender, study site, BMI, exercise, smoking. Alcohol use, systolic BP, anti- hypertensive drug use, total cholesterol-to-HDL cholesterol ratio, lipid-lowering drug use, diabetes drug use, family history of MI, aspirin use, GFR, and serum homocysteine. Additional adjustment for SES (income, education, no health insurance) and daily energy intake (in kilocalories) 2100 1.10 0.97 to 1.25 0.1553
Table 5. Fully Adjusted Relative Risk Regression Model Predicting Incident CAC (longitudinal) Calcium Intake Quintile Median Ca Intake Risk Relative 95% Confidence Limits_______________________ P Value Q1 < 424 mg 300 1.00 Reference ---- Q2 424 to 639 mg 530 1.15 0.88 to 1.51 0.3130 Q3 640 to939 mg 790 1.21 0.92 to 1.59 0.1636 Q4 940 to 1472 mg 1205 1.02 0.75 to 1.36 0.9152 Q5 > 1473 mg _______________________________________________________________________ Adjusted for age, gender, study site, BMI, exercise, smoking. Alcohol use, systolic BP, anti- hypertensive drug use, total cholesterol-to-HDL cholesterol ratio, lipid-lowering drug use, diabetes drug use, family history of MI, aspirin use, GFR, and serum homocysteine. Same Ca quartiles identical to cross sectional analysis for comparability Confidence intervals are wide 2100 1.21 0.90 to 1.64 0.2098
Figure 1. Median Calcium Intakes for Each Quintile in Model [CAC > 0]
Summary This exploratory, hypothesis-generating study is based on cross-sectional data and it should serve as a base for prospective MESA data that hopefully will be able to answer whether high intakes of dietary calcium (> RDAs) modify the risk of CAC. Role of supplements remains unclear. While non-significant, our current observation of a non-linear association suggests the possibility that excessive intakes of dietary calcium from foods plus supplements may impact on CAC in older adults. Participants in Q5 are of interest.
Summary: Part 2 Additional of socioeconomic variables and total energy intake weaken but do not eliminate the non-linear association Longitudinal results are preliminary and included for context Q4 still seems different in this group as well but power is reduced compared with cross-sectional analysis
