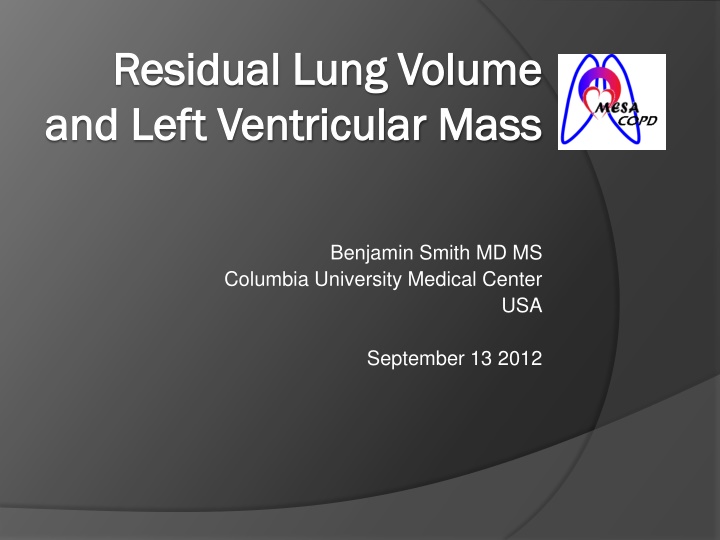
Associations Between Residual Lung Volume and Left Ventricular Mass
This study explores the relationship between residual lung volume and left ventricular mass, highlighting the potential impact on cardiovascular health. Increased left ventricular mass is linked to higher risks of mortality and cardiovascular events. The hypothesis suggests that hyperinflation, as indicated by residual lung volume, may be associated with greater left ventricular mass, independent of traditional risk factors. The research methodology involves the MESA COPD Study at Columbia University, targeting individuals aged 50-79 years without clinical cardiovascular disease. By examining the interactions between lung function and cardiac health, this investigation aims to provide insights into potential mechanisms underlying cardiovascular diseases in individuals with COPD.

Download Presentation

Please find below an Image/Link to download the presentation.
The content on the website is provided AS IS for your information and personal use only. It may not be sold, licensed, or shared on other websites without obtaining consent from the author. If you encounter any issues during the download, it is possible that the publisher has removed the file from their server.
You are allowed to download the files provided on this website for personal or commercial use, subject to the condition that they are used lawfully. All files are the property of their respective owners.
The content on the website is provided AS IS for your information and personal use only. It may not be sold, licensed, or shared on other websites without obtaining consent from the author.
E N D
Presentation Transcript
Residual Lung Volume Residual Lung Volume and Left Ventricular Mass and Left Ventricular Mass Benjamin Smith MD MS Columbia University Medical Center USA September 13 2012
Background Left ventricular (LV) mass predicts incident cardiovascular events Per 10% increase in LV mass there is: 14% greater risk of all-cause mortality 18% greater risk of cardiovascular death 40% greater risk of incident heart failure Levy D, et al. N Engl J Med 1990;322:1561-6. Haider, et al. J Am Coll Cardiol 1998;32:1454-9. Bluemke DA, et al. J Am Coll Cardiol 2008;52:2148-55.
Background LV mass is determined by LV wall stress LV wall stress LV transmural pressure Fessler and Permutt. The Thorax Part B 1995.
Background Cardiovascular disease and COPD co-exist COPD may increase LV wall stress AIRFLOW OBSTRUCTION HYPERINFLATION MORE NEGATIVE INSPIRATORY PLEURAL PRESSURE LV TRANSMURAL PRESSURE WALLSTRESS LV MASS
Background P Lung Volume (mL) Hyperinflation P Normal lung volume - Pleural Pressure (cm H2O) Tidal breathing Inspiratory in pleural pressure Controls at rest COPD at rest COPD on exercise -2 mmHg -4 to -10 mmHg -13 to -16 mmHg Potter WA, et al. J Clin Invest 1971;50:910-9. O'Connell JM, Campbell AH. Thorax 1976;31:669-77. Montes de Oca M, et al. Am J Respir Crit Care Med 1996;154:1284-9.
Background Inspiratory pleural pressures alter juxtacardiac pressures Mueller Maneuver Anterior LV Lateral LV Right Ventricle Pesophageal Takata M, et al. J Appl Physiol 1990;68:1640-50
Hypothesis Hyperinflation, as measured by residual lung volume, is associated with greater LV mass, independent of blood pressure, body size and other traditional cardiac risk factors
Methods MESA COPD Study at Columbia University Inclusion: 50-79 yrs, 10 pack-years Exclusion: clinical cardiovascular disease, cancer, other chronic lung disease, >300lbs Participants recruited from a population-based cohort study (Emphysema and Cancer Action Project) Additional participants with COPD were recruited from the outpatient community
Methods Outcome variable Primary: LV mass quantified by cardiac MR Secondary: LV mass to LV end-diastolic volume ratio Exposure variable Residual lung volume
Methods Co-variates Model 1 Age, gender, race-ethnicity, level of education attained Height, weight, body-size indexing term specific to LV mass CT emphysema (% lung volume <-950HU) and post- bronchodilator FEV1 Model 2 Model 1 co-variates + Smoking status (by serum cotinine), pack-years Systolic BP (resting, seated, measured 3 times), hypertension Cholesterol level, lipid lowering med use Fasting glucose and diabetes status : (height0.561*weight0.608) Brumback LC et al. Int J Cardiovasc Imaging 2010;26:459-68.
Methods Analysis: Multiple linear regression Participants were weighted by the inverse ratio of sample prevalence to source study prevalence of COPD
Anthropometrics Quartiles of Percent Predicted Residual Volume 1.33 L N=29 N=30 69 5 69 6 59 53 Characteristic Residual lung volume No. Age years Male sex % Race or ethnic group % Caucasian African American Other Height cm Weight kg Body-surface area m2 * Plus-minus values are means standard deviation. 1.73 L 2.09 L N=30 69 8 50 2.89 L N=30 68 6 60 66 17 17 77 13 10 80 17 3 77 23 0 169 11 77 16 1.9 0.2 168 9 79 17 1.9 0.2 167 10 75 18 1.9 0.3 169 9 76 19 1.9 0.3
Risk factors Quartiles of Percent Predicted Residual Volume 1.33 L N=29 N=30 28 40 36 (27) 32 (26) 119 15 119 16 24 40 96 (19) 104 (22) 7 13 183 36 197 45 52 27 Characteristic Residual lung volume No. Current smoker % Pack-years median (IQR) Systolic blood pressure mmHg Hypertension % Glucose mg/dl median (IQR) Diabetes mellitus % Total Cholesterol mg/dl Lipid lowering med use % * Plus-minus values are means standard deviation. 1.73 L 2.09 L N=30 33 40 (30) 126 18 57 102 (20) 20 187 41 50 2.89 L N=30 50 50 (34) 123 13 53 98 (17) 20 178 37 37
Cardiopulmonary measures Quartiles of Percent Predicted Residual Volume 1.33 L N=29 N=30 45 53 Characteristic Residual lung volume No. COPD % COPD Severity % Mild Moderate Severe/Very severe Emphysema % -950 HU median (IQR) LV Mass grams LV EDV mL LV Mass : LV EDV ratio LV Ejection fraction % * Plus-minus values are means standard deviation. 1.73 L 2.09 L N=30 70 2.89 L N=30 90 31 14 0 23 30 0 37 27 27 7 43 40 1.2 (2.4) 122 29 121 26 1.03 0.18 59 6 1.4 (2.4) 131 39 116 26 1.13 0.26 62 7 1.7 (3.9) 129 34 114 23 1.13 0.17 60 7 7.7 (16) 131 35 112 36 1.20 0.22 60 8
Primary hypothesis Mean change in grams of LV mass per standard deviation increase In residual lung volume (95% CI) 7.2 grams (2.4 to 12 grams) Residual lung volume (1 SD = 0.71 L) P Value Model 1 0.004 * Model 1 adjusted for age, gender, race or ethnic group, height, weight, body-size indexing term, education level, percent emphysema-950 HU and FEV1. Model 2 additionally adjusted for smoking status, pack-years, systolic blood pressure, hypertension, fasting plasma glucose level, diabetes, total cholesterol level and lipid lowering medication use.
Primary hypothesis Mean change in grams of LV mass per standard deviation increase In residual lung volume (95% CI) 7.2 grams (2.4 to 12 grams) 6.6 grams (2.3 to 11 grams) Residual lung volume (1 SD = 0.71 L) P Value Model 1 0.004 Model 2 0.003 * Model 1 adjusted for age, gender, race or ethnic group, height, weight, body-size indexing term, education level, percent emphysema-950 HU and FEV1. Model 2 additionally adjusted for smoking status, pack-years, systolic blood pressure, hypertension, fasting plasma glucose level, diabetes, total cholesterol level and lipid lowering medication use. Systolic blood pressure (1 SD = 16 mmHg) 7.4 grams <0.001 (4.1 to 11 grams)
Primary hypothesis 190 P=0.01 Predicted left ventricular mass (grams) 170 150 130 110 Residual lung volume (L) * GAM model adjusted for age, gender, race or ethnic group, height, weight, body-size indexing term, education level, percent emphysema-950 HU, FEV1, smoking status, pack-years, systolic blood pressure, hypertension, fasting glucose level, diabetes, total cholesterol level and lipid lowering medication use. Test for non-linearity: p=0.23.
Sensitivity analyses Predicted change in LV mass (grams) per SD increase in residual volume * Original model adjusted for age, gender, race or ethnic group, height, weight, body-size indexing term, education level, percent emphysema-950 HU, FEV1, smoking status, pack-years, systolic blood pressure, hypertension, fasting glucose level, diabetes, total cholesterol level and lipid lowering medication use.
Secondary analyses Mean change in LV mass : LV EDV ratio per standard deviation increase In residual lung volume (95% CI) 0.08 (0.02 to 0.15) 0.06 (0.01 to 0.12) Residual lung volume (1 SD = 0.71 L) P Value Model 1 0.02 Model 2 0.03 * Model 1 adjusted for age, gender, race or ethnic group, height, weight, body-size indexing term, education level, percent emphysema-950 HU and FEV1. Model 2 additionally adjusted for smoking status, pack-years, systolic blood pressure, hypertension, fasting plasma glucose level, diabetes, total cholesterol level and lipid lowering medication use.
Limitations Cross-sectional design Residual confounding Underlying mechanism not assessed HYPERINFLATION LV MASS
Hypothesis Hyperinflation, as measured by residual lung volume, is associated with greater inspiratory changes in intra-thoracic pressure
Methods Consecutive patients undergoing cardiac catheterization and lung volume measurement at CUMC (2009-2011) Inclusion: >45 yrs Exclusion: Prior CABG, heart/lung transplant, lobectomy LV EF < 50%, valve disease, congenital heart disease Acute MI, arrhythmia, PCI or mechanical ventilation
Methods Pressure-time waveforms stored digitally (GE Hemodynamic recording system) LV pressure Pulmonary artery occlusion (PAO) pressure Aortic root pressure
Methods Pressure-time waveform analysis: Inspiratory pressure change: Pexpiration Pinspiration LV pressure waveform (mmHg) 200 Exp. Exp. Insp. Insp. = 10 mmHg 100 Coefficient of variation: LV: 5.6% PAO: 7.6% Aortic root: 7.7% 0 Time (s)
Methods Outcome variable Primary: Inspiratory change in LV diastolic pressure Secondary: Inspiratory change in PAO and aortic root pressures Exposure variable Residual lung volume
Methods Analysis: GEE for repeated measures Robust standard errors Co-variates: Age, gender, height, weight, body-surface area
Results With acceptable waveforms 61 9 32 (44) 167 15 76 21 1.8 0.3 60 (83) 2.6 1.4 N=72 Age years Male sex - no. (%) Height cm Weight kg Body-surface area m2 COPD no. (%) Residual lung volume L Unacceptable waveforms (n=3): arrhythmia (2) and less than 2 breaths on waveform (1).
Results With acceptable waveforms N=72 Indication for catheterization no. (%) Pre lung transplant evaluation Abnormal stress test / dyspnea evaluation Pre operative evaluation Pulmonary hypertension evaluation Aortic root catheterization: Aortic root systolic pressure mmHg Aortic root diastolic pressure mmHg Pulmonary artery catheterization: PAO pressure mmHg LV catheterization: LV diastolic pressure mmHg 37 (51) 19 (26) 8 (11) 8 (11) N=42 123 25 74 12 N=60 10 5.0 N=32 3.0 4.5 * Plus-minus values are means standard deviation.
Results Mean change in the magnitude of inspiratory pressure variation (mmHg) per standard deviation increase in residual volume (95% CI) LV diastolic pressure N=32 2.1 (0.9 to 3.4) P=0.001 * Predicted mean changes in all models adjusted for age, gender, height, weight and body surface area and lung volume indicated. Residual volume
Results Mean change in the magnitude of inspiratory pressure variation (mmHg) per standard deviation increase in residual volume (95% CI) LV diastolic pressure N=32 N=60 2.1 (0.9 to 3.4) P=0.001 P=0.002 * Predicted mean changes in all models adjusted for age, gender, height, weight and body surface area and lung volume indicated. PAO pressure Aortic root systolic pressure N=42 3.6 (1.7 to 5.5) P<0.001 Aortic root diastolic pressure N=42 1.5 (0.9 to 2.2) P<0.001 2.1 Residual volume (0.8 to 3.5)
Limitations Cross-sectional design Not population-based Emphysema not assessed Effect of exercise not assessed
Summary In a population with predominantly mild-to- moderate COPD, higher residual volume was independently associated with greater LV mass The magnitude of association was similar to that of systolic blood pressure Residual volume is also associated with greater inspiratory change in intrathoracic pressure
Implications Hyperinflation, as measured by residual volume, may represent: a novel risk factor for cardiovascular disease an unmeasured form of hypertension a novel therapeutic target for cardiovascular disease
Acknowledgements Columbia University: R. Graham Barr (PI) Robert C Basner Daniel Rabinowitz Steven Shea Martin R Prince LeRoy Rabbani Daichi Shimbo University of Pennsylvania: Steven Kawut Northwestern University: Ravi Kalhan Johns Hopkins University: Jo o A Lima Chia-Ying Liu Erin D Michos National Institutes of Health: David A Bluemke Funding: NIH/NHLBI R01-HL093081 R01-HL077612 R01-HL075476 N01-HC95159-HC95169 Fonds de la recherche en sant Qu bec University of California Los Angeles: Antoinette S Gomes University of Iowa: Eric Hoffman
References Murphy SL, et al. National Center for Health Statistics; 2012 April 2, 2012. Levy D, et al. N Engl J Med 1990;322:1561-6. Bluemke DA, et al. J Am Coll Cardiol 2008;52:2148-55. Oparil S. J Am Coll Cardiol 1985;5:57B-65B. Rutten FH, et al. Eur Heart J 2005;26:1887-94. Curkendall SM, et al. Ann Epidemiol 2006;16:63-70. Leith DE, et al. Eur Respir J 1999;13:468-72. Brumback LC et al. Int J Cardiovasc Imaging 2010;26:459-68. Fessler and Permutt. The Thorax Part B 1995.
Additional Sensitivity Analyses n Predicted mean change in left ventricular mass (grams) per standard deviation change in residual lung volume
Standard errors Standard errors were computed by first summing empirical estimates of the covariance matrices of COPD-stratum specific contributions to the gradient of the weighted sum of squares, and pre- and post- multiplying by the matrices of mixed partial derivatives of the gradient weighted sum of squares evaluated at the weighted least squares solutions (analogous to generalized estimated equation estimator)
Methods Outcome variable Primary: LV mass quantified by cardiac MR Secondary: LV mass to LV end-diastolic volume ratio Exposure variable Primary: Residual lung volume Secondary: Residual volume to total lung capacity ratio (RV/TLC) Functional residual capacity (FRC) Total lung capacity (TLC)
Other lung volumes Mean change in grams of LV mass per standard deviation increase In hyperinflation metric (95% CI) 5.0 grams (1.1 to 8.8 grams) 2.6 grams (-3.0 to 8.1 grams) 5.3 grams (-1.6 to 12 grams) P Hyperinflation Metric Value RV/TLC 0.01 Functional residual capacity 0.36 Total lung capacity 0.13 * Results presented use model 2 co-variates. Predicted mean changes adjusted for age, gender, race or ethnic group, height, weight, body-size indexing term, education level attained, percent emphysema-950 HU, FEV1 smoking status (current versus former), pack-years of smoking history, systolic blood pressure, hypertension, fasting plasma glucose level, diabetes, total cholesterol level and lipid lowering medication use. Predicted mean change, along with 95% CI for the linear term of the variable specified were estimated using regression models. Abbreviations: LV denotes left ventricle, CI confidence interval, HU Hounsfield units, and FEV1 forced expired volume in the first second.
Other lung volumes Mean change in the magnitude of inspiratory pressure variation (mmHg) per standard deviation increase in variable indicated (95% CI) LV diastolic pressure N=32 N=60 2.1 (0.9 to 3.4) (0.8 to 3.5) (1.7 to 5.5) 2.1 (0.7 to 3.5) (1.5 to 3.6) (0.8 to 4.5) * Predicted mean changes in all models adjusted for age, gender, height, weight and body surface area and lung volume indicated. PAO pressure Aortic root systolic pressure N=42 3.6 Aortic root diastolic pressure N=42 1.5 (0.9 to 2.2) 1.0 (0.3 to 1.7) 2.1 Residual volume Residual volume to TLC ratio 2.6 2.7