Explore Austria's angiography and PCI centers with insights into practice patterns, trends, and procedures. Discover key data and reports related to coronary angiography and PCI frequency, highlighting quality assurance measures and outcomes over the years.
Please find below an Image/Link to download the presentation.
The content on the website is provided AS IS for your information and personal use only. It may not be sold, licensed, or shared on other websites without obtaining consent from the author. If you encounter any issues during the download, it is possible that the publisher has removed the file from their server.
You are allowed to download the files provided on this website for personal or commercial use, subject to the condition that they are used lawfully. All files are the property of their respective owners.
The content on the website is provided AS IS for your information and personal use only. It may not be sold, licensed, or shared on other websites without obtaining consent from the author.
E N D
Presentation Transcript
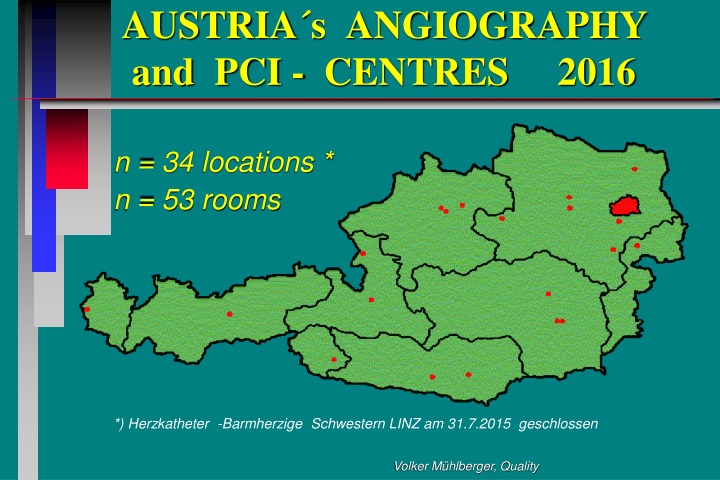
AUSTRIAs ANGIOGRAPHY and PCI - CENTRES 2016 n = 34 locations * n = 53 rooms *) Herzkatheter -Barmherzige Schwestern LINZ am 31.7.2015 geschlossen Volker M hlberger, Quality
Monitor (Auditor) Report: 1989 2016 (update 29 VII 16) www.iik.i-med.ac.at Lalit Kaltenbach, Hanno Ulmer www.ptca.ch: Marco Roffi Fabio Rigamonti, Bernhard Meier, Stephane Cook,Micha T. Maeder M.Vestweber www.herzbericht.de R ckmeldequote 75% f r 2014 E. Bruckenberger: bis 2011 sterreichische Spezialregister Volker M hlberger, Quality
AustrianNationalCAthLAbRegisty ANCALAR to describe practice patterns and trends, to identify outliers and to detect safety signals Lauer MS, D Agostino RB NEJM 2013; 369:1579-81 Volker M hlberger, Quality
Coronary Angiography Frequency per Million Inhabitants 1992-2016 12000 10000 8000 AU 8.1-8.4-8.6-8.7 CH 7.4 - 7.95 D 82.2 - 80.8 - 81.2 CZ 10.0-10.5 SL 5.5 -5.4 6000 4000 2000 0 Volker M hlberger, Quality
% PCI/ CA 1992 - 2015 (AU/CH/D/CZ) 60 50 40 AU 30 CH 20 D CZ 10 0 Volker M hlberger, Quality
PCI per One Million Inhabitants (AU/CH/D/CZ/USA) 1991-2015 5000 4500 4000 USA 3500 3000 AU 2500 2000 CH 1500 D 1000 CZ 500 0 Volker M hlberger, Quality
Number of tables and CENTERS (AU) with > 36 STEMI - PCI / year + center 60 53 52 50 40 34 34 30 27 24 24 23 centers 20 10 tables 0 2003 2004 2005 2006 2007 2008 2009 2010 2011 2012 2013 2014 2015 >36 STEMI- PCI/y+c Volker M hlberger, Quality Silber 2005 / DiMario 2006; ESC
PCI Frequency in Austria 2006-2015 acute or non-acute Indications 25000 2304422538 21698 19263 1934219727 1985620294 20295 20543 20000 15253 14454 15000 142541332813041 13073 13828 13349 1351714550 10000 NICHT AKUT 5000 8084 7791 7148 7026 6946 6783 6686 6466 6014 5009 AKUT PCI 0 2006 2007 2008 2009 2010 2011 2012 2013 2014 2015 Volker M hlberger, Quality
PCI -Mortality (ref.=overall-% mortality in Austria) (non-acute / without /with shock) 1.20 1.00 0.80 non-acute PCI bezogen auf Gesamt PCI 0.60 0.40 PCI for MI without Shock bezogen auf Gesamt PCI PCI for MI with Shock bezogen auf Gesamt PCI 0.20 0.00 Volker M hlberger, Quality
Intra aortic balloon pump for PCI in Austria 2005 -2014 (CH 2012/13) 500 450 400 350 300 AUT CH 250 200 150 100 50 0 2005 2006 2007 2008 2009 2010 2011 2012 2013 2014 2015 Volker M hlberger, Quality
DRUG ELUTING stents (DES) in AU,CH,D,EU-CZ (% of stents) 120 100 80 60 AU CH D EU CZ CZ 40 EU EU 20 0 Volker M hlberger, Quality
DES/stent and re-stenosis REDO reporting Centres (% of stent - AU) DES % REDO % (reporting Centers only) 100 80 60 40 6.3 6.6 20 4,7 4.64 0 20022003200420052006200720082009201020112012201320142015 Volker M hlberger, Quality
AUT 2012 (%) CH 14 12 10 8 AUT CH 6 4 2 0 Volker M hlberger, Quality
AUT 2013 (%) CH 14 12 10 8 AUT CH 6 4 2 0 Volker M hlberger, Quality
AUT 2014 (%) CH 12 10 8 AUT CH 6 4 2 0 Volker M hlberger, Quality
AUT 2012 (n) CH 900 800 700 600 AUT CH 500 400 300 200 100 0 Volker M hlberger, Quality
AUT 2013 (n) CH 900 800 700 600 AUT CH 500 400 300 200 100 0 Volker M hlberger, Quality
AUT 2014 (n) CH 900 800 700 AUT 600 500 CH 400 300 200 100 0 Volker M hlberger, Quality
Austria vs. CH 2002 2015 LAA closure (n) 300 250 200 150 AU CH 0 100 50 0 Volker M hlberger, Quality
OLD and NEW DEVICES (n<40.000/a) Austria 1992 -2015 50000 45000 40000 35000 STENT DES 30000 25000 IVUS ROTABL i.c.PRESSURE 20000 15000 10000 5000 0 Volker M hlberger, Quality
OLD and NEW DEVICES (n<3000/a) Austria 2002-2015 3500 Catheter Trombectomy/clot catcher 3000 DE Balloon 2500 Defektverschl. 2000 1500 1000 500 0 Volker M hlberger, Quality
OLD and NEW DEVICES (n<400/a) Austria 2002-2015 400 350 300 250 MitraClip Thrombin lokal NOGA mapping REnalDenerv PTSMA 200 150 100 50 0 Volker M hlberger, Quality


 Report:")


")


 approach")
 access (AU):")
")
")
")

")

 in")
")
")

")


")
")


")
")
")
 in")
 / Electrophysiology (n; %) &")