Austrian Business Cycle Theory and Macroeconomic Models
Explore the concept of Austrian Business Cycle Theory and the fundamentals of macroeconomic models through a detailed presentation with figures depicting the magic formula for economic growth, examples of business cycles, and the structure of production. Gain insights into investment, capital accumulation, savings, productivity, and their impact on economic growth and living standards.
Download Presentation

Please find below an Image/Link to download the presentation.
The content on the website is provided AS IS for your information and personal use only. It may not be sold, licensed, or shared on other websites without obtaining consent from the author. If you encounter any issues during the download, it is possible that the publisher has removed the file from their server.
You are allowed to download the files provided on this website for personal or commercial use, subject to the condition that they are used lawfully. All files are the property of their respective owners.
The content on the website is provided AS IS for your information and personal use only. It may not be sold, licensed, or shared on other websites without obtaining consent from the author.
E N D
Presentation Transcript
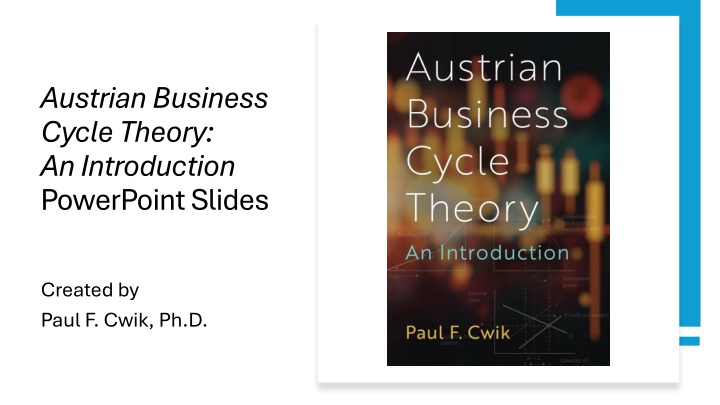
Austrian Business Cycle Theory: An Introduction PowerPoint Slides Created by Paul F. Cwik, Ph.D.
Economic growth Say s Law or the magic formula
Figure 1: The magic formula for economic growth Figure 1: The magic formula for economic growth Investment Capital accumulation Savings Productivity More stuff Higher living standards
Figure 1: The magic formula for economic growth Figure 1: The magic formula for economic growth Investment Capital accumulation Savings Productivity More stuff Higher living standards
A business cycle A simple example
Figure 2: A business cycle Figure 2: A business cycle Upper turning point GDP Trend Time
Building the macroeconomic model Part 1: The structure of production (SOP)
Figure 3: Structure of production (SOP) Figure 3: Structure of production (SOP) Value Consumer goods Manufacturing Wholesale materials Retail Raw Time
Figure 4: The role of resources and labor in the structure of Figure 4: The role of resources and labor in the structure of production (SOP) production (SOP) Value Value Resources and labor are added at each stage Output Manufacturing Wholesale materials Retail Raw Time Physical capital equipment is embedded within each stage
Figure 5: Structure of production with markets Figure 5: Structure of production with markets Markets Value Value Output Manufacturing Wholesale materials Retail Raw Time
How many stages are there? How many stages are there? In figure 5, we used four stages. However, there are uncountable many stages in the production process. We can represent these many stages as a triangle.
Figure 6: Structure of production as a triangle Figure 6: Structure of production as a triangle Value Output Manufacturing Wholesale materials Retail Raw Time
Roundaboutness: lengthening the structure of production Roundaboutness: lengthening the structure of production Roundaboutness is an essential concept in Austrian Capital Theory. In 1889, Eugen von B hm-Bawerk argued that to increase production, the capital structure would have to become more roundabout or complex. Why Why would entrepreneurs make their production process more complex complex? more
Adding Length Adding Length The purpose purpose of lengthening the production process is, obviously, to increase increase profits profits. This change could manifest in a faster assembly line, higher quality products, more diverse products, etc. We need to recognize that adding length for its own sake is counterproductive. What matters is that the overall SOP is efficient balance balance. efficient when it is in
Adding Length: continued Adding Length: continued Auto manufacturers used drafting tables. today they use computers. Is this lengthening the SOP? Yes. Who made the computers? Who made the software? What are all the steps in between? We have added complexity added complexity to the production process, and we call that being more roundabout more roundabout.
The structure of production becomes more roundabout The structure of production becomes more roundabout Value Output Manufacturing Wholesale materials Design Retail Raw Time
Building the macroeconomic model Part 2: The production possibilities frontier
Figure 7: The Garrisonian production possibility frontier Figure 7: The Garrisonian production possibility frontier Consumer goods 105 100 90 75 A B C D E 50 F 0 Investment goods 60 80 20 0 40
Figure 8: PPF shift showing economic growth Figure 8: PPF shift showing economic growth Consumer goods A2 C2 Outside the PPF is unsustainable. On the PPF, the economy is at full employment. Inside the PPF, the economy is in a recession. C1 A1 A0 I2 I1 Investment goods
Building the macroeconomic model Part 3: The loanable funds market
Figure 9: The loanable funds market Figure 9: The loanable funds market Interest rate Supply = Savers People who need $ now for an investment People who love to spend Both Supply and Demand are based on time preference i1 Borrowers with options People who are natural savers Demand = Borrowers S1 = I1 Quantity of loanable funds
Putting the macroeconomic model together
Figure 10: The Garrisonian macroeconomic model Figure 10: The Garrisonian macroeconomic model Consumer Goods A0 C0 C0 SOP PPF Time I0 Investment Goods Interest Rates S = Savers i0 D = Borrowers Loanable funds market Quantity of loanable funds S0 = I0
Scenario 1 People become more patient People become more patient
Suppose people become more patient Suppose people become more patient How does this change affect the model? What happens to consumption and savings decisions? How do investors and entrepreneurs react?
Figure 11: People become more patient Figure 11: People become more patient Consumer Goods A0 C0 C0 A1 C1 C1 SOP PPF Time Investment Goods I1 I0 S = Savers Interest Rates Suppose that people become more patient. What happens? S i0 i1 D = Borrowers Loanable funds market Quantity of loanable funds S1 = I1 S0 = I0
Figure 12: Changes in the structure of production Figure 12: Changes in the structure of production Consumer Goods Starting with the SOP in equilibrium C0 C1 Next, we make the SOP more Roundabout Time What do the other schools of economics do about this? The factor markets supply each of these stages, and each is affected differently. They tend to ignore it. Price Price Supply Supply P1 Po Po P1 D Demand Demand D Q1 Qo Q1 Qo Quantity Quantity Late-stage Goods Early-stage Goods
Figure 13: The macroeconomy with economic growth Figure 13: The macroeconomy with economic growth Consumer Goods Expanded PPF C1 C1 C0 C0 Expanded SOP Time I1 I0 Investment Goods Interest Rates S S (with new savings ) D (with new business) i0 i1 D Quantity of loanable funds S1= I1 S0= I0
Scenario 2 A price ceiling on interest rates A price ceiling on interest rates
Suppose the government places a price ceiling on interest rates Suppose the government places a price ceiling on interest rates How does this change affect the model? What happens to consumption and savings decisions? How do investors and entrepreneurs react?
Figure 14: A price ceiling on interest rates Figure 14: A price ceiling on interest rates Consumer Goods C2 A2 C2 A0 C0 C0 SOP PPF Time I0 I2 Investment Goods Interest Rates S Suppose that a price ceiling is placed on interest rates. What happens? i0 Price ceiling D Loanable funds market Quantity of loanable funds S2 I1 S0 = I0 Credit Shortage Amount entrepreneurs want Amount available
Scenario 3 The business cycle
The Austrian view of the business cycle The Austrian view of the business cycle 1. 2. 3. Artificial Credit Expansion Malinvestment Boom Crunch (Upper turning point) Credit Crunch (and/or) Real Resource Crunch Recession / Liquidation Phase Recovery 4. 5.
Beginning the unsustainable malinvestment boom Beginning the unsustainable malinvestment boom Suppose that the interest rate is 6% (as it was in 2001) and the firm is considering a project that will yield 4%. Will it engage in the project? Suppose the Central Bank lowers the interest rate from 6% to 1% (like it was in 2003). Now, what will the firm do?
Figure 15: The unsustainable boom Figure 15: The unsustainable boom Consumer Goods A1 C1 C1 Unsustainable production beyond the PPF C0 C0 Dueling SOP A0 Time I1 I0 Investment Goods Interest Rates S S (with new money) i0 i1 D Loanable funds market S0= I0 Quantity of loanable funds I1 S1
Figure 16: Malinvesting capital inputs Figure 16: Malinvesting capital inputs There is enough for 4 houses. Can we start 6 foundations?
Malinvestment boom: Malinvestment boom: As firms compete for resources, input prices are driven up making them look for more funding. Competition causes interest rates to rise. In the scramble for funds, short-term rates rise more than long- term rates.
Figure 18: The components of the yield curve Figure 18: The components of the yield curve Interest rates Yield curve 1) Time preference 2) Inflation risk 3) Liquidity preference Time preference + Inflation risk + Liquidity preference Time preference + Inflation risk Time preference Length of maturity
An inverted yield curve and the yield curve An inverted yield curve and the yield curve Interest rates Inverted yield curve Yield curve Length of maturity
Yield Curve Spreads Between Since April 1953 5.00 4.00 3.00 2.00 1.00 Recession Spread 10 year - 3 month Spread 10 year - 1 year Spread 20 year - 3 month Spread 20 year - 1 year Spread 30 year - 3 month Spread 30 year - 1 year 0.00 1953-04 1955-04 1957-04 1959-04 1961-04 1963-04 1965-04 1967-04 1969-04 1971-04 1973-04 1975-04 1977-04 1979-04 1981-04 1983-04 1985-04 1987-04 1989-04 1991-04 1993-04 1995-04 1997-04 1999-04 2001-04 2003-04 2005-04 2007-04 2009-04 2011-04 2013-04 2015-04 2017-04 2019-04 2021-04 2023-04 2025-04 -1.00 -2.00 -3.00 -4.00 -5.00 Recessions are dated according to the NBER. The data for interest rates were obtained from FRED.
Yield Curve Spreads Since 2000 5.00 4.00 3.00 2.00 1.00 Recession Spread 10 year - 3 month Spread 10 year - 1 year Spread 20 year - 3 month Spread 20 year - 1 year Spread 30 year - 3 month Spread 30 year - 1 year 0.00 2000-01 2002-01 2004-01 2006-01 2008-01 2010-01 2012-01 2014-01 2016-01 2018-01 2020-01 2022-01 2024-01 -1.00 -2.00 -3.00 -4.00 -5.00 Recessions are dated according to the NBER. The data for interest rates were obtained from FRED.
Yield Curve Spreads Since 2014 5.00 4.00 3.00 2.00 Recession Spread 10 year - 3 month 1.00 Spread 10 year - 1 year 0.00 Spread 20 year - 3 month 2014-01 2016-01 2018-01 2020-01 2022-01 2024-01 Spread 20 year - 1 year -1.00 Spread 30 year - 3 month -2.00 Spread 30 year - 1 year -3.00 -4.00 -5.00 Recessions are dated according to the NBER. The data for interest rates were obtained from FRED.
The Fed has a choice The Fed has a choice The central bank has a decision to make: either halt the expansion, The result of this policy is a credit crunch credit crunch. or expand the money supply at a faster rate. The eventual result of this policy is a real resource crunch real resource crunch.
The Crunch: The Crunch: When the crisis hits, there are two problems facing the entrepreneur: increasing interest rates increasing interest rates and rising input costs rising input costs. (Rising costs are more devastating to businesses.) The story centers on how the central bank distorted the intertemporal price the interest rate. Entrepreneurs made a Cluster of Errors they were given were falsified. Cluster of Errors because the signals
The Crunch: continued The Crunch: continued An increase in interest rates impacts both working capital and fixed capital. The longer lived the capital equipment, the greater the impact on its value. Projects with longer time horizons will also see larger swings in value (Net Present Value).
Figure 17: The recession Figure 17: The recession Consumer Goods C1 C1 Unsustainable production beyond the PPF C0 C2 C0 C2 Collapsing SOP Time I1 I0 I2 Investment Goods Interest Rates S S i0 i1 S (with new money) i2 = D D Loanable funds market S0= I0 Quantity of loanable funds S1 I1 S2= I2
Liquidation phase: Liquidation phase: Only through the process of converting the malinvestments into productive capital can the foundation for growth be achieved. The firms that invested during the malinvestment boom suffer economic losses. They sell their capital equipment at a discounted rate to other firms. These other firms can turn an economic profit even at the previous prices because these firms have purchased the capital equipment at a discount.
Liquidation phase: continued Liquidation phase: continued Suppose GM truly went bankrupt in 2009 This liquidation process is how the malinvestments are converted into new fixed capital equipment. This process is necessary for normal economic growth to resume.
Steps to make the bad less bad Steps to make the bad less bad 1. Don t inflate more. 2. Make the bankruptcy process easier. 3. Make mergers and acquisitions easier. 4. Increase savings by: A. cutting the capital gains tax. B. moving from an income tax to a consumption tax. C. reducing crowding-out through cutting government spending, balancing the budget, and perhaps by paying down the national debt.
Recovery Recovery: : Recovery is the same process as normal growth. In other words, the magic formula for economic growth Savings Investment Capital Accumulation Higher Productivity More Stuff Higher Living Standards

