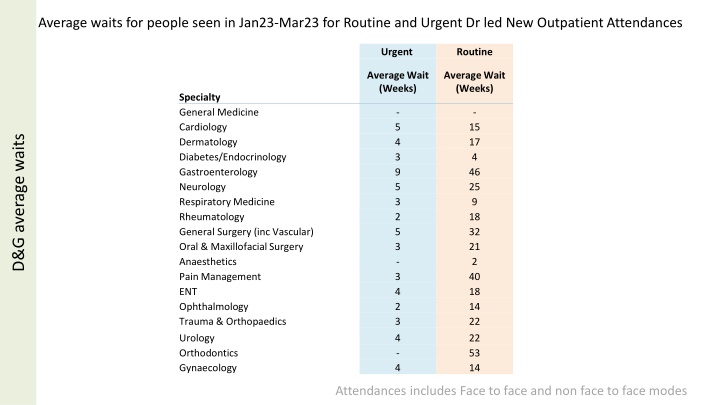
Average Waits for Outpatient Attendances and Procedures
This data presents average waiting times for new outpatient attendances and diagnostic procedures across various specialties from January 2023 to March 2023. It includes wait times for routine and urgent cases in different clinical areas such as General Medicine, Cardiology, Dermatology, Gynaecology, and more. Additionally, average waits for procedures based on clinical priority levels are highlighted, along with specific diagnostic scopes and radiology exams. The information aims to provide insights into wait times for healthcare services in different specialty areas.

Download Presentation

Please find below an Image/Link to download the presentation.
The content on the website is provided AS IS for your information and personal use only. It may not be sold, licensed, or shared on other websites without obtaining consent from the author. If you encounter any issues during the download, it is possible that the publisher has removed the file from their server.
You are allowed to download the files provided on this website for personal or commercial use, subject to the condition that they are used lawfully. All files are the property of their respective owners.
The content on the website is provided AS IS for your information and personal use only. It may not be sold, licensed, or shared on other websites without obtaining consent from the author.
E N D
Presentation Transcript
Average waits for people seen in Jan23-Mar23 for Routine and Urgent Dr led New Outpatient Attendances Urgent Routine Average Wait (Weeks) Average Wait (Weeks) Specialty General Medicine Cardiology Dermatology Diabetes/Endocrinology Gastroenterology Neurology Respiratory Medicine Rheumatology General Surgery (inc Vascular) Oral & Maxillofacial Surgery Anaesthetics Pain Management ENT Ophthalmology Trauma & Orthopaedics Urology Orthodontics Gynaecology - 5 4 3 9 5 3 2 5 3 - 3 4 2 3 4 - 4 - 15 17 4 46 25 9 18 32 21 2 40 18 14 22 22 53 14 D&G average waits Attendances includes Face to face and non face to face modes
Average waits from list date to procedure under TTG for people seen in Jan23-Mar23 by clinical priority P2 P3 P4 No category Average Wait (Weeks) Average Wait (Weeks) Average Wait (Weeks) Average Wait (Weeks) Specialty ENT General Surgery (exc Vascular) Vascular Surgery Gynaecology Ophthalmology Oral & Maxillofacial Surgery Trauma & Orthopaedics Urology Gastroenterology D&G average waits 6 7 8 5 7 38 30 10 19 26 40 54 15 8 36 37 - 22 38 19 51 43 29 - 0 - 3 - - - 1 - 10 13 12 4 Clinical Priority: P2 - Surgery that can be deferred for up to 4 weeks P3 - Surgery that can be delayed for up to 3 months P4 - Surgery that can be delayed for more than 3 months
Average waits for New Diagnostic Scope for people seen in Jan23 Mar23 Urgent Routine Average Wait (Weeks) Average Wait (Weeks) D&G average waits Scope Upper GI Flexible Sigmoidoscopy Colonoscopy Cystoscopy 4.2 4.0 4.3 3.5 8.0 7.8 10.8 8.0
Average waits for Radiology exams (CT, MRI and US modalities) for people seen in Jan23 Mar23 Urgent Routine Average Wait (Weeks) Average Wait (Weeks) D&G average waits Exam CT MRI US 3.9 5.2 1.9 7.8 7.3 3.6 Scans requested by GP or through Outpatients only, excludes scans requested by A&E or Inpatients Time from request to exam carried out