Baltic States: Recovery, Outlook, Challenges - Economic Crossroads
This presentation delves into the recovery progress, outlook, and challenges faced by the Baltic States post-2011 economic crisis. It covers key indicators like GDP levels, domestic demand, growth contributions, export market shares, and wage trends, providing insights into the region's economic landscape.
Download Presentation

Please find below an Image/Link to download the presentation.
The content on the website is provided AS IS for your information and personal use only. It may not be sold, licensed, or shared on other websites without obtaining consent from the author.If you encounter any issues during the download, it is possible that the publisher has removed the file from their server.
You are allowed to download the files provided on this website for personal or commercial use, subject to the condition that they are used lawfully. All files are the property of their respective owners.
The content on the website is provided AS IS for your information and personal use only. It may not be sold, licensed, or shared on other websites without obtaining consent from the author.
E N D
Presentation Transcript
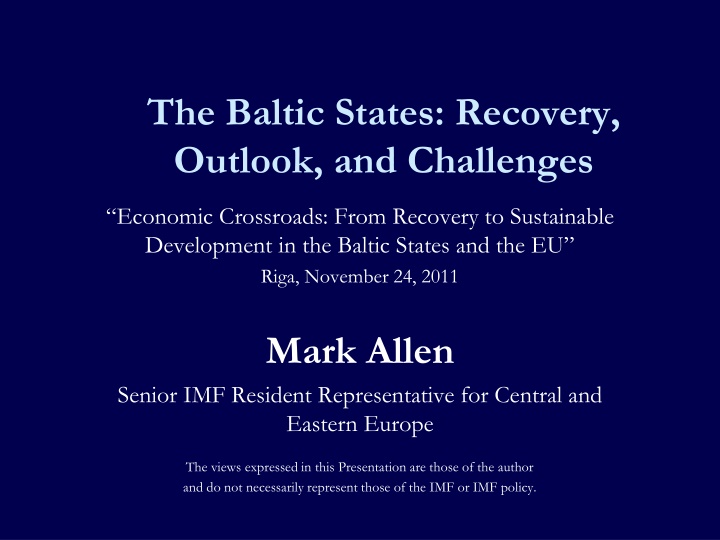
The Baltic States: Recovery, Outlook, and Challenges Economic Crossroads: From Recovery to Sustainable Development in the Baltic States and the EU Riga, November 24, 2011 Mark Allen Senior IMF Resident Representative for Central and Eastern Europe The views expressed in this Presentation are those of the author and do not necessarily represent those of the IMF or IMF policy.
Scope of the presentation Recovery in the Baltic States Outlook beyond the Baltic States Vulnerabilities to tackle 2
Scope of the presentation Recovery in the Baltic States 3
GDP has recovered to 2005/6 levels GDP level (2004 = 100) 150 140 130 120 110 100 90 80 2004 2005 2006 2007 2008 2009 2010 2011 2012 Estonia Latvia Lithuania 4 Source: WEO database.
but domestic demand is lagging Domestic demand level (2004 = 100) 150 140 130 120 110 100 90 80 2004 2005 2006 2007 2008 2009 2010 2011 2012 Estonia Latvia Lithuania 5 Source: WEO database.
although now contributing to growth. Contributions to Growth (percent points) 20 10 0 -10 -20 -30 Domestic Absorbtion Foreign Balance GDP -40 2009 2010 2011 2012 2009 2010 2011 2012 2009 2010 2011 2012 Estonia Latvia Lithuania 6 Source: WEO database
Exports are gaining market shares. Export markets growth (Weighted by 2007 export patterns) 15 Estonia Latvia Lithuania Market size index Exports s.a. 10 5 0 -5 -10 -15 Mar-07 Sep-07 Sep-08 Sep-09 Sep-10 Sep-07 Sep-08 Sep-09 Sep-10 Sep-07 Sep-08 Sep-09 Sep-10 Mar-07 Mar-08 Mar-09 Mar-10 Mar-11 Mar-07 Mar-08 Mar-09 Mar-10 Mar-11 Mar-08 Mar-09 Mar-10 Mar-11 7 Source: IMF, Direction of Trade; World Economic Outlook; Eurostat
There has been some correction in wages... Average Gross Earnings (Mar-04=100) 260 Estonia Latvia Lithuania (excl. Indivdual enterprises) Germany 240 220 200 180 160 140 120 100 2011 (f) 2012 (f) Q1-2005 Q3-2011 Q1-2004 Q3-2004 Q3-2005 Q1-2006 Q3-2006 Q1-2007 Q3-2007 Q1-2008 Q3-2008 Q1-2009 Q3-2009 Q1-2010 Q3-2010 Q1-2011 8 Source: Haver; IMF Country Reports
and unemployment is falling from the peak. Unemployment rate (percent) 25 Estonia 20 Latvia 15 Lithuania 10 5 0 2004Q1 2004Q3 2005Q1 2005Q3 2006Q1 2006Q3 2007Q1 2007Q3 2008Q1 2008Q3 2009Q1 2009Q3 2010Q1 2010Q3 2011Q1 9 Source: IMF, IFS
Market perceptions have improved remarkably. CDS spreads (basis points) 1200 600 Bulgaria Hungary 1000 500 Romania Estonia Lithuania Latvia 800 400 600 300 400 200 200 100 0 0 10 Source: Bloomberg
Scope of the presentation Recovery in the Baltic States Outlook beyond the Baltic States 11
The world economic recovery is sluggish GDP Growth (percent) 15 10 5 0 -5 United States Euro area Japan EMs -10 -15 2000Q1 2001Q1 2002Q1 2003Q1 2004Q1 2005Q1 2006Q1 2007Q1 2008Q1 2009Q1 2010Q1 2011Q1 2012Q1 12 Source: WEO database.
and world trade is not looking healthy. Growth of Trade (percent) 60 40 20 0 -20 -40 Trade value -60 CPB trade volume index* -80 Jan/00Jan/01Jan/02Jan/03Jan/04Jan/05Jan/06Jan/07Jan/08Jan/09Jan/10Jan/11 *Trade volume is calculated from the trade value deflated by CPB estimated price series 13 Source: WEO database.
Advanced economy prospects have worsened sharply. Consensus GDP Growth Forecasts for 2012 (percent) 3.5 WEO Forecasts 3.0 USA Japan Germany France UK Italy 2.5 2.0 1.5 1.0 0.5 0.0 -0.5 14 Source: ConsensusForecasts.
A third wave of fear has hit the markets Market Volatility Index (VIX S&P 500) 90 Lehman Greece Eurozone 80 70 60 50 40 30 20 10 0 Apr-07 Apr-09 Apr-10 Apr-11 Apr-08 Jan-07 Jan-08 Jan-09 Jan-10 Jan-11 Jul-07 Jul-08 Jul-09 Jul-10 Jul-11 Oct-09 Oct-07 Oct-08 Oct-10 Oct-11 15 Source: Yahoo Finance.
and European banks are under pressure. Banks 5yr CDS Spreads (basis points) 600 Deutsche Bank Unicredit BNP Paribas Erste Santander Raiffeisen 500 400 300 200 100 0 Apr-09 Apr-10 Apr-11 Apr-08 Jan-08 Jan-09 Jan-10 Jan-11 Jul-08 Jul-09 Jul-10 Jul-11 Oct-08 Oct-09 Oct-10 Oct-11 16 Source: Bloomberg.
Scope of the presentation Recovery in the Baltic States Outlook beyond the Baltic States Vulnerabilities to tackle 17
Current accounts are no longer a risk factor. Current Account Balance (percent of GDP) 10 5 0 -5 -10 -15 -20 -25 2004 2005 2006 2007 2008 2009 2010 2011 2012 Estonia Latvia Lithuania 18 Source: IMF, World Economic Outlook
But total external debt, while coming down, remains high Gross External Debt (percent of exports) 400 350 300 250 200 150 100 50 0 2004 2005 2006 2007 2008 Latvia 2009 Lithuania 2010 2011 2012 Estonia 19 Source: IMF, World Economic Outlook
especially private sector debt. Private Sector External Debt (percent of GDP) 200 180 160 140 120 100 80 60 40 20 0 2004 2005 2006 2007 2008 Latvia 2009 Lithuania 2010 2011 2012 Estonia 20 Source: IMF, World Economic Outlook
This is reflected in lower foreign bank exposure Foreign Bank Exposure (USD millions) Decline from the peak (Jun-08) 25000 20000 15000 -36% 10000 -30% -31% 5000 0 Jun-04 Dec-04 Jun-05 Dec-05 Jun-06 Dec-06 Jun-07 Dec-07 Jun-08 Dec-08 Jun.09 Dec.09 Jun.10 Dec.10 Jun.11 21 Source: BIS
Fiscal positions are returning to Maastricht 2000 2001 2002 2003 2004 2005 2006 2007 2008 2009 2010 2011 2012 4 Maastricht zone Fiscal Balance (percent of GDP) 2 2000 2012 0 2012 -2 2012 2000 -4 2000 -6 -8 -10 0 10 20 30 40 50 60 Public Debt (percent of GDP) Slide by slide Slide by slide Estonia Latvia Lithuania 22 Source: WEO database.
Credit growth has stalled and NPLs peaked. Non-performing Loans to Total Loans (percent ) and Credit Growth (year-on-year percent change) Estonia Credit Estonia NPLs (rhs) Latvia Credit Latvia NPLs (rhs) Lithuania Credit Lithuania NPLs (rhs) 110 22 20 90 18 16 70 14 12 50 10 8 30 6 4 10 2 0 -10 -2 2005 2006 2007 2008 2009 2010 2011 23 Source: Haver, National banks, Latvian Financial and Capital Market Commission
Capital adequacy ratios have been strengthened Capital Adequacy Ratio 25 20 15 10 5 0 2004 2005 2006 2007 2008 2009 2010 2011 Estonia Latvia Lithuania 24 Source: IMF staff
And the banking sectors are becoming more profitable Return on Assets 3 2 1 0 -1 -2 -3 -4 -5 2004 2005 2006 2007 2008 2009 2010 2011 Estonia Latvia Lithuania 25 Source: IMF staff
But loan-to-deposit ratio remain very elevated. Loan-to-Deposit Ratio 300 250 200 150 100 50 0 2004 2005 2006 2007 2008 2009 2010 2011 Estonia Latvia Lithuania 26 Source: Haver
Thank you 27
Fiscal positions are returning to Maastricht 2000 2001 2002 2003 2004 2005 2006 2007 2008 2009 2010 2011 2012 4 Maastricht zone Fiscal Balance (percent of GDP) 2 2000 0 -2 2000 -4 2000 -6 -8 -10 0 10 20 30 40 50 60 Public Debt (percent of GDP) Estonia Latvia Lithuania 29 Source: WEO database.
Fiscal positions are returning to Maastricht 2000 2001 2002 2003 2004 2005 2006 2007 2008 2009 2010 2011 2012 4 Maastricht zone Fiscal Balance (percent of GDP) 2 2000 0 -2 2000 -4 2000 -6 -8 -10 0 10 20 30 40 50 60 Public Debt (percent of GDP) Estonia Latvia Lithuania 30 Source: WEO database.
Fiscal positions are returning to Maastricht 2000 2001 2002 2003 2004 2005 2006 2007 2008 2009 2010 2011 2012 4 Maastricht zone Fiscal Balance (percent of GDP) 2 2000 0 -2 2000 -4 2000 -6 -8 -10 0 10 20 30 40 50 60 Public Debt (percent of GDP) Estonia Latvia Lithuania 31 Source: WEO database.
Fiscal positions are returning to Maastricht 2000 2001 2002 2003 2004 2005 2006 2007 2008 2009 2010 2011 2012 4 Maastricht zone Fiscal Balance (percent of GDP) 2 2000 0 -2 2000 -4 2000 -6 -8 -10 0 10 20 30 40 50 60 Public Debt (percent of GDP) Estonia Latvia Lithuania 32 Source: WEO database.
Fiscal positions are returning to Maastricht 2000 2001 2002 2003 2004 2005 2006 2007 2008 2009 2010 2011 2012 4 Maastricht zone Fiscal Balance (percent of GDP) 2 2000 0 -2 2000 -4 2000 -6 -8 -10 0 10 20 30 40 50 60 Public Debt (percent of GDP) Estonia Latvia Lithuania 33 Source: WEO database.
Fiscal positions are returning to Maastricht 2000 2001 2002 2003 2004 2005 2006 2007 2008 2009 2010 2011 2012 4 Maastricht zone Fiscal Balance (percent of GDP) 2 2000 0 -2 2000 -4 2000 -6 -8 -10 0 10 20 30 40 50 60 Public Debt (percent of GDP) Estonia Latvia Lithuania 34 Source: WEO database.
Fiscal positions are returning to Maastricht 2000 2001 2002 2003 2004 2005 2006 2007 2008 2009 2010 2011 2012 4 Maastricht zone Fiscal Balance (percent of GDP) 2 2000 0 -2 2000 -4 2000 -6 -8 -10 0 10 20 30 40 50 60 Public Debt (percent of GDP) Estonia Latvia Lithuania 35 Source: WEO database.
Fiscal positions are returning to Maastricht 2000 2001 2002 2003 2004 2005 2006 2007 2008 2009 2010 2011 2012 4 Maastricht zone Fiscal Balance (percent of GDP) 2 2000 0 -2 2000 -4 2000 -6 -8 -10 0 10 20 30 40 50 60 Public Debt (percent of GDP) Estonia Latvia Lithuania 36 Source: WEO database.
Fiscal positions are returning to Maastricht 2000 2001 2002 2003 2004 2005 2006 2007 2008 2009 2010 2011 2012 4 Maastricht zone Fiscal Balance (percent of GDP) 2 2000 2012 0 2012 -2 2012 2000 -4 2000 -6 -8 -10 0 10 20 30 40 50 60 Public Debt (percent of GDP) Return Estonia Latvia Lithuania 37 Return Source: WEO database.
