Banking Crisis Analysis: Losses, Failures, and Regulatory Implications
Discover the impact of rising rates on banks in 2022 resulting in over $600B in losses, drawing parallels to past crises. Dive into the study analyzing securities investments and mortgage impacts while examining the need for enhanced regulatory oversight. Explore the contrasting failures of Silicon Valley Bank and Lehman Brothers, shedding light on the causes behind their closures.
Download Presentation

Please find below an Image/Link to download the presentation.
The content on the website is provided AS IS for your information and personal use only. It may not be sold, licensed, or shared on other websites without obtaining consent from the author. If you encounter any issues during the download, it is possible that the publisher has removed the file from their server.
You are allowed to download the files provided on this website for personal or commercial use, subject to the condition that they are used lawfully. All files are the property of their respective owners.
The content on the website is provided AS IS for your information and personal use only. It may not be sold, licensed, or shared on other websites without obtaining consent from the author.
E N D
Presentation Transcript
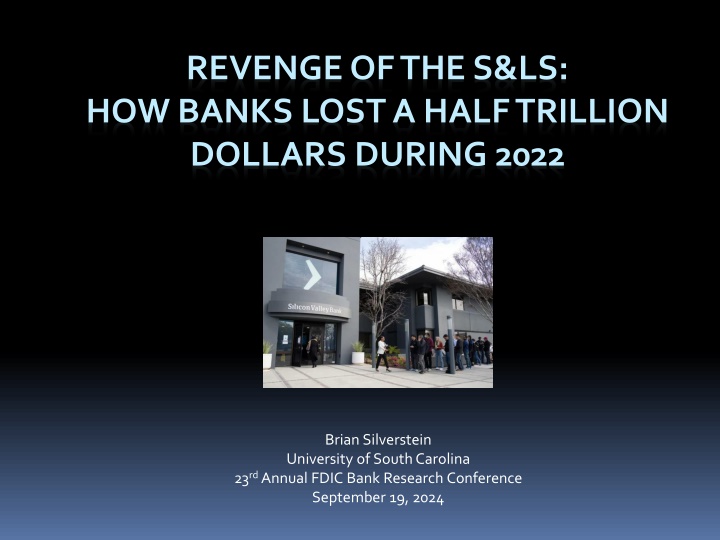
REVENGE OF THE S&LS: HOW BANKS LOST A HALF TRILLION DOLLARS DURING 2022 Brian Silverstein University of South Carolina 23rdAnnual FDIC Bank Research Conference September 19, 2024
REVENGE OF THE S&LS: HOW BANKS LOST A HALF TRILLION DOLLARS DURING 2022 Rebel A. Cole Florida Atlantic University Brian Silverstein University of South Carolina Jon R. Taylor Michigan State University Susan M. Wachter University of Pennsylvania Lawrence J. White New York University
Summary In 2022, U.S. banks saw $600B+ in unrealized losses on their security portfolios as the Fed raised rates by 400 bps to fight inflation. This mirrors the early 1980s S&L crisis, where rising rates led to similar losses, despite post-crisis regulatory reforms.
Summary In this study, we analyzed bank investments in various securities (Treasuries, Munis, RMBS, CMBS) and mortgages (commercial/residential) in explaining losses. We find that RMBS investments were the most pernicious during 2020-2021, driven by yield-seeking amid pandemic deposit inflows. We also investigated if equity markets priced these losses, and, if not, whether there is a need for better regulatory oversight of interest rate risk.
A Tale of Two Banking Crises: 2008 and 2023 On Mar. 10, 2023, Silicon Valley Bank was closed by its regulators, sparking a wave of contagion that threatened to spread throughout the banking system. At the time, many called it a Lehman moment, in reference to the bankruptcy filing by the investment bank Lehman Brothers on Sep. 15, 2008, that ushered in the near collapse of the U.S. financial system.
A Tale of Two Banking Crises: 2008 and 2023 These two events had little in common: SVB was a commercial bank; LB was an investment bank. Their failures had fundamentally different causes: SVB failed due to securities losses from interest rate risk. LB failed due to securities losses from credit risk.
A Tale of Two Banking Crises: 2008 and 2023 When we look at the number of bank failures by year, we see only one crisis: Number of Bank Failures 2000 - 2023 180 157 160 2008-2014. 140 140 507 banks failed. 120 During 2023, there were only five bank failures. 100 92 80 60 51 40 25 24 18 20 11 8 8 5 5 4 4 4 4 3 3 0 0 0 0 0 0 2023 2020 2022 2021 2004 2002 2006 2007 2009 2017 2001 2003 2005 2008 2011 2015 2018 2010 2013 2014 2016 2019 2012
A Tale of Two Banking Crises: 2008 and 2023 When we look at the assets of bank failures by year, we now see two crises: Assets ($Billions) of Failed Banks 2000 - 2023 600.0 548.7 500.0 2008-2012: $689 billion. 400.0 373.6 2023: $549 billion. 300.0 200.0 170.9 96.5 100.0 36.0 12.16.13.16.70.36.50.00.20.50.00.0 2.42.71.00.20.00.02.6 0.0 2021 2023 2020 2022 2004 2008 2002 2006 2007 2009 2012 2017 2001 2003 2005 2011 2015 2018 2010 2013 2014 2016 2019
The 2023 Banking Crisis Surprisingly, there was no banking crisis during the 2020 2021 in response to the COVID-19 pandemic. Unemployment spiked, and GDP plummeted. The Federal Government propped up the U.S. economy with a wide array of relief programs, injecting trillions of dollars into the economy.
The 2023 Banking Crisis: Fiscal Stimulus Annual U.S. Federal Deficit/Surplus 1980-2023 1.0 0.0 1980 1981 1982 1983 1984 1985 1986 1987 1988 1989 1990 1991 1992 1993 1994 1995 1996 1997 1998 1999 2000 2001 2002 2003 2004 2005 2006 2007 2008 2009 2010 2011 2012 2013 2014 2015 2016 2017 2018 2019 2020 2021 2022 2023 $ Trillions -1.0 -2.0 -3.0 -4.0 However, this massive deficit spending during the pandemic period by the federal government continued into 2022 and 2023. $6 Trillion during 2020-2021. Another $3 Trillion during 2022-2023. Much of this fiscal stimulus ended up as bank deposits.
The 2023 Banking Crisis: Inflation CPI Inflation Rate 2013 -2023 10.0% 8.0% 6.0% 4.0% 2.0% 0.0% 1/1/2023 10/1/2017 10/1/2018 1/1/2020 4/1/2023 10/1/2013 10/1/2015 4/1/2021 1/1/2022 4/1/2022 10/1/2014 10/1/2016 10/1/2019 4/1/2020 1/1/2021 7/1/2020 4/1/2016 4/1/2017 1/1/2018 4/1/2019 7/1/2021 7/1/2022 1/1/2013 1/1/2014 1/1/2015 4/1/2015 4/1/2018 7/1/2023 4/1/2013 4/1/2014 1/1/2016 1/1/2017 1/1/2019 10/1/2021 10/1/2020 10/1/2022 7/1/2013 7/1/2014 7/1/2015 7/1/2016 7/1/2018 7/1/2019 7/1/2017 -2.0% Fiscal stimulus led to rising inflation. The Fed and Treasury initially deemed inflation "transitory" and expected it to subside. Inflation accelerated in 2022, peaking at 8.9% in June, forcing decisive Fed action.
The 2023 Banking Crisis: The Fed s Response to Rising Inflation In early 2020, the Fed cut rates from 2.5% to 0.08%. Federal Funds Rate 2008 - 2023 7.0 Starting in March 2022, the target Fed Funds Rate increased from 0.08% to 5.33% by August 2023. 6.0 5.0 4.0 Percent 3.0 This was the fastest rate increase in the Fed s history. 2.0 1.0 0.0 Source: Federal Reserve Economic Data (FRED)
The 2023 Banking Crisis: The Bond Market s Response to Rising Inflation The Treasury-bond market responded to rising inflation in 2021. 10-Year Treasury Bond Yield 2013 - 2023 6.0 5.0 10-Year bond yields rose to 2.0% before the first Fed rate hike in March 2022. 4.0 3.0 Yields peaked at 5.0% in October 2023, retreating to around 3.8% today. 2.0 1.0 0.0 01-Nov-18 01-Dec-22 01-Aug-20 01-May-22 01-Jul-23 01-Jan-20 01-Oct-21 01-Aug-13 01-Jul-16 01-Mar-21 01-Jan-13 01-Mar-14 01-May-15 01-Jun-19 01-Dec-15 01-Feb-17 01-Sep-17 01-Oct-14 01-Apr-18 Source: Federal Reserve Economic Data (FRED)
The 2023 Banking Crisis: Deposit Inflows during the Pandemic During 2020, total deposits grew by more than $3 Trillion, from $13 Trillion to $16 Trillion. Change in Deposits and Investment Securities 2011 - 2022 3,500 3,000 2,500 Over $2 trillion of deposit inflows were invested in securities. 2,000 1,500 1,000 500 This raised bank-owned securities by over 50%, from $3.6 trillion in 2019 to $5.6 trillion in 2021. - 2011 2012 2013 2014 2015 2016 2017 2018 2019 2020 2021 2022 (500) Securities Deposits
The 2023 Banking Crisis: Repricing Maturity Expansion During 2020 & 2021, Banks, in aggregate, increased interest risk in security portfolios. Avg. Repricing Maturity of Bank Security Portfolios 9.00 4.5% 4.0% 8.50 3.5% 8.00 3.0% Prior to 2020, banks, on average, maintained repricing maturities at 7.2 years. Repricing 2.5% Yield 7.50 2.0% 7.00 1.5% 1.0% 6.50 0.5% 6.00 0.0% At the end of 2021, the average bank repricing maturity was up ~22% to 8.8 years. Average Security Portfolio Repricing 10 Year Treasury Yield
The 2023 Banking Crisis: How did rising rates affect banks? Banks were caught off guard by rising T-bond yields in 2022-2023. Unrealized losses on securities surged from: $28 billion in Q4 2021 to $470 billion in Q2 2022 and $690 billion in Q3 2022. These losses exceed 50% of regulatory capital at over 500 banks, including 100 banks with more than $1 billion in assets.
The 2023 Banking Crisis: Silicon Valley Bank On the morning of March 10, 2023, regulators unexpectedly closed Silicon Valley Bank, triggering fears of systemic contagion. SVB, the 13th largest U.S. bank with over $200 billion in assets, became the second-largest bank failure in U.S. history. The Friday morning closure hinted at regulatory unpreparedness.
The 2023 Banking Crisis: Fallout from SVB s closure SVB wasn t alone in facing unrealized losses and over-reliance on uninsured deposits. Many large regional banks had similar vulnerabilities, which depositors and investors quickly recognized. On March 10, regional bank stocks plummeted, triggering depositor runs at multiple banks.
The 2023 Banking Crisis: Fallout from SVB s closure Signature Bank of NY, the 19th largest U.S. bank with $100 billion in assets, catered to crypto businesses. Regulators closed the bank on March 12, making it the third-largest bank failure in U.S. history. First Republic Bank, the 12th largest U.S. bank with $212 billion in assets, had significant real estate exposure. Regulators closed FRB on May 1, marking FRB the second largest bank failure in U.S. history.
The 2023 Banking Crisis: Residential Mortgages Rising interest rates have devalued both banks' security portfolios and their $2.5 trillion in residential mortgages (primarily 30-year fixed-rate). As of Q2 2024, unrealized losses on these mortgages could reach an additional $250 billion, based on RMBS loss trends.
The 2023 Banking Crisis: Commercial Mortgages Rising interest rates are expected to cause significant losses on banks' $2.5 trillion commercial mortgage portfolios. These typically have 5-year terms, with half maturing in the next 24 months, requiring refinancing. Existing rates of 3-4% have risen to 7-10%, rendering many properties cash-flow negative.
The 2023 Banking Crisis: Commercial Real Estate Appreciation This chart shows the quarterly change in CRE property values based upon the benchmark NCREIF index. NCREIF Commercial Real Estate Appreciation Returns 1978Q1 - 2023Q3 6.0% 4.0% 2.0% 0.0% Note that property values have only fallen three times in the past 45 years: 19781 19792 19803 19814 19831 19842 19853 19864 19881 19892 19903 19914 19931 19942 19953 19964 19981 19992 20003 20014 20031 20042 20053 20064 20081 20092 20103 20114 20131 20142 20153 20164 20181 20192 20203 20214 20231 -2.0% -4.0% Early 1990s -6.0% 2008-2009 -8.0% -10.0% 2022-2023
The 2023 Banking Crisis: Commercial Mortgages Of the 156 banks with more than $10 billion in assets, 50 have CRE exposure greater than 300% of their regulatory capital. Among all 4,697 banks: 1,646 have CRE exposure greater than 300% 899 have exposures greater than 400%, and 404 have exposures greater than 500%. Regulators consider 300% to be excessive asset concentration.
Methodology: Unrealized Securities Losses We estimate a series of OLS regressions where the dependent variable is the ratio of unrealized securities losses to total assets and the explanatory variables are bank portfolio allocations of their assets to different types of securities and mortgages: ???? ??????= ?0 + ?1 ?????????? + ?2 ?????????? + ?3 ???????+ ?4 ??????? +?5 ?????????? + ?6 ?????????? + ??
Methodology: Unrealized Securities Losses ???? ?????? is the ratio of unrealized security losses to assets; ????????? ?is the ratio of Treasury securities to assets; ??????????is the ratio of municipal securities to assets; ???????is the ratio of residential mortgage-backed securities (RMBS) to assets; ???????is the ratio of commercial mortgage-backed securities (CMBS) to assets; ?????????? is the ratio of residential mortgages to assets; ??????????is the ratio of commercial mortgages to assets; and ?? is an i.i.d error term.
Descriptive Statistics Table 1: This table shows descriptive statistics for the following variables. ????????? is the ratio of unrealized securities losses (expressed as a positive value) to total assets. These statistics are based upon quarterly financial data reported by 4,697 U.S. commercial banks for Q2 2023. Std. Error 0.000 0.002 0.001 0.001 0.001 0.000 0.002 0.002 0.002 0.001 Variable seclossta govsecta treasecta munisecta Municipal Securities to Assets rmbsta Residental MBS to Assets cmbsta CRE MBS to Assets m14ta Residential Mortgages to Assets creta CRE Mortgages to Assets te_ta Total Equity Capital to Assets cet1ta CET1 Capital to Assets Label Obs. 4,697 4,697 4,697 4,697 4,697 4,697 4,697 4,697 4,697 4,697 Mean 0.025 0.158 0.082 0.076 0.074 0.010 0.172 0.159 0.113 0.127 Min 0.000 0.000 0.000 0.000 0.000 0.000 0.000 0.000 -0.048 0.044 p25 0.008 0.049 0.013 0.005 0.005 0.000 0.070 0.063 0.075 0.093 p50 0.020 0.125 0.046 0.040 0.047 0.000 0.138 0.141 0.093 0.105 p75 0.036 0.229 0.116 0.115 0.107 0.009 0.235 0.232 0.115 0.126 Max 0.189 1.037 1.037 0.784 0.814 0.520 0.909 0.767 1.000 1.040 Securities Losses to Assets Govt. Securities to Assets Treasury Securities to Assets
Descriptive Statistics By Ratio of Securities Losses to Assets Table 2: This table shows descriptive statistics and differences in means of banks with below and above median securities losses (as a percentage of total assets). Securities Losses to Assets Low High Difference in Means t-Statistic -0.033 -0.133 -0.042 -0.091 -0.088 -0.011 0.040 0.049 0.048 0.020 Variable seclossta govsecta treasecta munisecta Municipal Securities to Assets rmbsta Residental MBS to Assets cmbsta CRE MBS to Assets m14ta Residential Mortgages to Assets creta CRE Mortgages to Assets te_ta Total Equity Capital to Assets cet1ta CET1 Capital to Assets Label Securities Losses to Assets Govt. Securities to Assets Treasury Securities to Assets Mean Std.Error 0.009 0.091 0.061 0.031 0.030 0.004 0.192 0.184 0.136 0.137 Mean 0.042 0.224 0.103 0.121 0.118 0.016 0.152 0.135 0.089 0.117 Std. Error 0.0004 0.0030 0.0024 0.0023 0.0022 0.0007 0.0024 0.0020 0.0014 0.0013 0.0001 0.0020 0.0017 0.0010 0.0008 0.0003 0.0034 0.0028 0.0028 0.0026 -75.30 *** -36.86 *** -14.45 *** -36.36 *** -37.90 *** -16.08 *** 9.48 *** 14.26 *** 15.32 *** 6.83 ***
Correlations Table 3: This table shows the correlation coefficients for the following variables. These correlations are based upon quarterly financial data reported by 4,697 U.S. commercial banks for Q2 2023. seclossta govsectatreasectamunisecta rmbsta cmbsta m14ta creta te_ta cet1ta seclossta Securities Losses to Assets 1.000 govsecta Govt. Securities to Assets 0.578 1.000 treasecta Treasury Securities to Assets 0.220 0.725 1.000 munisecta Municipal Securities to Assets 0.606 0.683 -0.008 1.000 rmbsta Residental MBS to Assets 0.575 -0.026 -0.154 0.126 1.000 cmbsta CRE MBS to Assets 0.257 -0.023 -0.090 0.061 0.210 1.000 m14ta Residential Mortgages to Assets -0.168 -0.235 -0.153 -0.179 -0.107 -0.088 1.000 creta CRE Mortgages to Assets -0.252 -0.369 -0.256 -0.264 -0.120 -0.004 -0.147 1.000 te_ta Total Equity Capital to Assets -0.241 -0.077 0.044 -0.159 -0.131 -0.082 -0.105 -0.152 1.000 cet1ta CET1 Capital to Assets -0.078 0.037 0.086 -0.037 -0.039 -0.044 -0.128 -0.202 0.963 1.000
Correlations Table 3: This table shows the correlation coefficients for the following variables. These correlations are based upon quarterly financial data reported by 4,697 U.S. commercial banks for Q2 2023. seclossta govsectatreasectamunisecta rmbsta cmbsta m14ta creta te_ta cet1ta seclossta Securities Losses to Assets 1.000 govsecta Govt. Securities to Assets 0.578 1.000 treasecta Treasury Securities to Assets 0.220 0.725 1.000 munisecta Municipal Securities to Assets 0.606 0.683 -0.008 1.000 rmbsta Residental MBS to Assets 0.575 -0.026 -0.154 0.126 1.000 cmbsta CRE MBS to Assets 0.257 -0.023 -0.090 0.061 0.210 1.000 m14ta Residential Mortgages to Assets -0.168 -0.235 -0.153 -0.179 -0.107 -0.088 1.000 creta CRE Mortgages to Assets -0.252 -0.369 -0.256 -0.264 -0.120 -0.004 -0.147 1.000 te_ta Total Equity Capital to Assets -0.241 -0.077 0.044 -0.159 -0.131 -0.082 -0.105 -0.152 1.000 cet1ta CET1 Capital to Assets -0.078 0.037 0.086 -0.037 -0.039 -0.044 -0.128 -0.202 0.963 1.000
Regression Results: Determinants of Securities Losses to Total Assets Table 4: This table shows the results from a series of OLS regressions where the dependent variable is ?????????, which is the ratio of unrealized securities losses (expressed as a positive value) to total assets. These regressions are based upon quarterly financial data reported by 4,697 U.S. commercial banks for Q2 2023. Explanatory variables are based upon quarterly financial data reported by 4,697 banks for Q4 2021, prior to the first interest rate hike. t-statistics appear in parenthesis. *,**, and *** indicate statistical significance at the 10, 5, and 1 percent levels, respectively. Variable Label (1) (2) (3) (4) (5) (6) (7) treasecta Treasury Securities to Assets 0.0641*** (17.88) 0.0825*** (38.95) 0.121*** (61.75) 0.132*** (63.04) 0.103*** (14.47) 0.00296** (2.08) 0.00365** (1.96) -0.00223** (-2.52) munisecta Muni Securities to Assets 0.135*** (49.35) rmbsta RMBS to Assets 0.143*** (47.60) cmbsta CMBS to Assets 0.209*** (16.98) m14ta Res. Mortgages to Assets -0.0305*** (-12.46) creta CRE Mortgages to Assets -0.0544*** (-18.96) 0.0332*** (64.13) Constant 0.0216*** (57.07) 0.0147*** (43.45) 0.0149*** (43.44) 0.0231*** (68.06) 0.0299*** (61.41) Observations R-squared 4,673 0.064 4,673 0.343 4,673 0.327 4,673 0.058 4,673 0.032 4,673 0.071 4,673 0.712
Regression Results: Determinants of Securities Losses to Total Assets Table 4: This table shows the results from a series of OLS regressions where the dependent variable is ?????????, which is the ratio of unrealized securities losses (expressed as a positive value) to total assets. These regressions are based upon quarterly financial data reported by 4,697 U.S. commercial banks for Q2 2023. Explanatory variables are based upon quarterly financial data reported by 4,697 banks for Q4 2021, prior to the first interest rate hike. t-statistics appear in parenthesis. *,**, and *** indicate statistical significance at the 10, 5, and 1 percent levels, respectively. Variable Label (1) (2) (3) (4) (5) (6) (7) treasecta Treasury Securities to Assets 0.0641*** (17.88) 0.0825*** (38.95) 0.121*** (61.75) 0.132*** (63.04) 0.103*** (14.47) 0.00296** (2.08) 0.00365** (1.96) -0.00223** (-2.52) munisecta Muni Securities to Assets 0.135*** (49.35) rmbsta RMBS to Assets 0.143*** (47.60) cmbsta CMBS to Assets 0.209*** (16.98) m14ta Res. Mortgages to Assets -0.0305*** (-12.46) creta CRE Mortgages to Assets -0.0544*** (-18.96) 0.0332*** (64.13) Constant 0.0216*** (57.07) 0.0147*** (43.45) 0.0149*** (43.44) 0.0231*** (68.06) 0.0299*** (61.41) Observations R-squared 4,673 0.064 4,673 0.343 4,673 0.327 4,673 0.058 4,673 0.032 4,673 0.071 4,673 0.712
Event-Study Analysis of SVB Closure: Next, we test whether the sharp declines in bank stock values following Silicon Valley Bank's March 10, 2023, failure reflected disproportionate losses among banks exposed to interest-rate risk. First, we estimate excess returns around the failure by regressing daily bank stock returns against the S&P 500. Second, we analyze the cumulative abnormal returns (CARs) using the ratio of unrealized securities losses to total assets and portfolio allocations as key explanatory variables.
Event-Study Analysis of SVB Closure: High vs. Low Interest-Rate Risk Portfolios Average daily abnormal returns of Bank Holding Companies (BHCs) with high and low interest-rate risk in their security portfolios.
Event-Study Analysis of SVB Closure: High vs. Low Uninsured Deposits Average daily abnormal returns of Bank Holding Companies (BHCs) with high and low uninsured deposits.
Diff-in-Diff Analysis of Daily Abnormal Returns: Interest rate Risk Uninsured Deposits Unrealized Losses Combined (1) (2) (3) (4) (5) (6) (7) (8) High_Int_Risk Post SVB Failure -8.84 -7.569 -11.09 -9.263 (-1.164) (-1.010) (-1.363) (-1.149) High_Int_Risk 2.356 1.987 1.356 1.345 -0.867 -0.779 -0.472 -0.492 High Uninsured x Post SVB -25.069*** -19.016** -24.572*** -18.601** (-2.990) (-2.290) (-2.990) (-2.287) High Uninsured Dep -6.555** -4.883* -6.619** -4.947* (-2.308) (-1.811) (-2.312) (-1.816) High Unrealized Loss x Post SVB 0.081 -0.359 -0.011 (-0.048) High Unreal Losses -3.411 -3.178 (-1.253) (-1.241) Post SVB -83.712*** -63.033*** -79.263*** -59.645*** -88.246*** -66.698*** -73.983*** -55.234*** (-19.755) (-14.868) (-19.759) (-14.230) (-19.652) (-15.051) (-13.228) (-9.418) Constant -14.375*** -6.987*** -10.826*** -4.037* -11.44*** -4.358** -11.472*** -4.677** (-7.740) (-4.045) (-4.767) (-1.873) (-5.582) (-2.210) (-4.634) (-2.030) R-Squared 0.029 0.020 0.033 0.023 0.029 0.020 0.033 0.023 N 11,749 11,749 10,447 10,447 11,749 11,749 10,447 10,447 Post SVB failure equals on from March 9, 2023, through March 31, 2023, and zero before this period. BHC daily abnormal returns calculated using CAPM and Fama-French three factor model multiplied by 100.
Diff-in-Diff Analysis of Daily Abnormal Returns: Interest rate Risk Uninsured Deposits Unrealized Losses Combined (1) (2) (3) (4) (5) (6) (7) (8) High_Int_Risk Post SVB Failure -8.84 -7.569 -11.09 -9.263 (-1.164) (-1.010) (-1.363) (-1.149) High_Int_Risk 2.356 1.987 1.356 1.345 -0.867 -0.779 -0.472 -0.492 High Uninsured x Post SVB -25.069*** -19.016** -24.572*** -18.601** (-2.990) (-2.290) (-2.990) (-2.287) High Uninsured Dep -6.555** -4.883* -6.619** -4.947* (-2.308) (-1.811) (-2.312) (-1.816) High Unrealized Loss x Post SVB 0.081 -0.359 -0.011 (-0.048) High Unreal Losses -3.411 -3.178 (-1.253) (-1.241) Post SVB -83.712*** -63.033*** -79.263*** -59.645*** -88.246*** -66.698*** -73.983*** -55.234*** (-19.755) (-14.868) (-19.759) (-14.230) (-19.652) (-15.051) (-13.228) (-9.418) Constant -14.375*** -6.987*** -10.826*** -4.037* -11.44*** -4.358** -11.472*** -4.677** (-7.740) (-4.045) (-4.767) (-1.873) (-5.582) (-2.210) (-4.634) (-2.030) R-Squared 0.029 0.020 0.033 0.023 0.029 0.020 0.033 0.023 N 11,749 11,749 10,447 10,447 11,749 11,749 10,447 10,447 Post SVB failure equals on from March 9, 2023, through March 31, 2023, and zero before this period. BHC daily abnormal returns calculated using CAPM and Fama-French three factor model multiplied by 100.
Diff-in-Diff Analysis of Daily Abnormal Returns: Interest rate Risk Uninsured Deposits Unrealized Losses Combined (1) (2) (3) (4) (5) (6) (7) (8) High_Int_Risk Post SVB Failure -8.84 -7.569 -11.09 -9.263 (-1.164) (-1.010) (-1.363) (-1.149) High_Int_Risk 2.356 1.987 1.356 1.345 -0.867 -0.779 -0.472 -0.492 High Uninsured x Post SVB -25.069*** -19.016** -24.572*** -18.601** (-2.990) (-2.290) (-2.990) (-2.287) High Uninsured Dep -6.555** -4.883* -6.619** -4.947* (-2.308) (-1.811) (-2.312) (-1.816) High Unrealized Loss x Post SVB 0.081 -0.359 -0.011 (-0.048) High Unreal Losses -3.411 -3.178 (-1.253) (-1.241) Post SVB -83.712*** -63.033*** -79.263*** -59.645*** -88.246*** -66.698*** -73.983*** -55.234*** (-19.755) (-14.868) (-19.759) (-14.230) (-19.652) (-15.051) (-13.228) (-9.418) Constant -14.375*** -6.987*** -10.826*** -4.037* -11.44*** -4.358** -11.472*** -4.677** (-7.740) (-4.045) (-4.767) (-1.873) (-5.582) (-2.210) (-4.634) (-2.030) R-Squared 0.029 0.020 0.033 0.023 0.029 0.020 0.033 0.023 N 11,749 11,749 10,447 10,447 11,749 11,749 10,447 10,447 Post SVB failure equals on from March 9, 2023, through March 31, 2023, and zero before this period. BHC daily abnormal returns calculated using CAPM and Fama-French three factor model multiplied by 100.
Diff-in-Diff Analysis of Daily Abnormal Returns: Interest rate Risk Uninsured Deposits Unrealized Losses Combined (1) (2) (3) (4) (5) (6) (7) (8) High_Int_Risk Post SVB Failure -8.84 -7.569 -11.09 -9.263 (-1.164) (-1.010) (-1.363) (-1.149) High_Int_Risk 2.356 1.987 1.356 1.345 -0.867 -0.779 -0.472 -0.492 High Uninsured x Post SVB -25.069*** -19.016** -24.572*** -18.601** (-2.990) (-2.290) (-2.990) (-2.287) High Uninsured Dep -6.555** -4.883* -6.619** -4.947* (-2.308) (-1.811) (-2.312) (-1.816) High Unrealized Loss x Post SVB 0.081 -0.359 -0.011 (-0.048) High Unreal Losses -3.411 -3.178 (-1.253) (-1.241) Post SVB -83.712*** -63.033*** -79.263*** -59.645*** -88.246*** -66.698*** -73.983*** -55.234*** (-19.755) (-14.868) (-19.759) (-14.230) (-19.652) (-15.051) (-13.228) (-9.418) Constant -14.375*** -6.987*** -10.826*** -4.037* -11.44*** -4.358** -11.472*** -4.677** (-7.740) (-4.045) (-4.767) (-1.873) (-5.582) (-2.210) (-4.634) (-2.030) R-Squared 0.029 0.020 0.033 0.023 0.029 0.020 0.033 0.023 N 11,749 11,749 10,447 10,447 11,749 11,749 10,447 10,447 Post SVB failure equals on from March 9, 2023, through March 31, 2023, and zero before this period. BHC daily abnormal returns calculated using CAPM and Fama-French three factor model multiplied by 100.
Summary and Conclusions We analyzed the factors driving banks' unrealized losses on securities portfolios. We find that these losses are linked to holdings in RMBS and Treasuries, with RMBS causing twice the losses per dollar compared to Treasuries. Reaching for yield by banks led to significant losses, especially due to the longer durations and higher initial yields of RMBS.
Summary and Conclusions We also find that these losses are negatively associated with banks' holdings of residential and commercial mortgages. Banks that were lending had much smaller exposures to securities, especially to long-duration RMBS. However, unrealized losses on residential mortgages are likely to be similar in magnitude to those on RMBS. Future losses on commercial mortgages are uncertain, with over $1 trillion maturing next year.
Summary and Conclusions Finally, we find that, following the failure of SVB, equity markets focused on banks' uninsured deposits rather than interest-rate risk or unrealized losses. However, the risk for certain banks post-SVB stemmed from a combination of unrealized losses and uninsured deposits.


