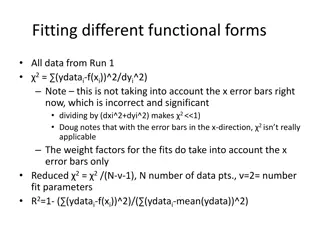
Based on the provided content, here are the requested elements: "Gaussian Curves: Maximum Likelihood vs. Bayesian Approach
"Explore the methods of fitting Gaussian curves on data points through Maximum Likelihood and Bayesian approaches for classification using Gaussian distribution parameters."

Download Presentation

Please find below an Image/Link to download the presentation.
The content on the website is provided AS IS for your information and personal use only. It may not be sold, licensed, or shared on other websites without obtaining consent from the author. If you encounter any issues during the download, it is possible that the publisher has removed the file from their server.
You are allowed to download the files provided on this website for personal or commercial use, subject to the condition that they are used lawfully. All files are the property of their respective owners.
The content on the website is provided AS IS for your information and personal use only. It may not be sold, licensed, or shared on other websites without obtaining consent from the author.
E N D
Presentation Transcript
Fitting Gaussian curves on data points The Maximum Likelihood and the Bayesian approach Gosztolya G bor Szegedi Tudom nyegyetem Informatikai Int zet 2023 / Mar / 09
Where are we? Classification, from a decision theory point of view:: Let us have a gi(x) discriminatory function for all classes It should be big for the feature space regions belonging to the given class and small otherwise Classification is done on the base of max gi(x) This implicitely sets the decision boundary between the classes Bayes decision rule: we need gi(x) = P(ci|x) for optimal classification This is equivalent to e.g. gi(x) = p(x|ci) P(ci) , we used this form in the last lecture, and we will use this now
Where are we? #2 We assumed that p(x|ci) is Gaussian for all classes And we examined how the decision surfaces look like for given parameters iand i We will still assume that the distribution is Gaussian But now we will learn how to estimate the iand i parameters from the data
Parameter estimation for Gaussians We want to estimate p(x|ci) and P(ci) from data samples The class priors form a discrete distribution, so they can easily be estimated by simple counting E.g. we have 2 classes, 60 examples from class 1 and 40 from class 2 Then we can estimate P(c1) 60 / (60+40), P(c2) 40 / (60+40)
Gauss-eloszlsok paramtereinek becslse If the features are continuous, then p(x|ci) is a multivariate continuous distribution, much more difficult to estimate We will assume that p(x|ci) is Gaussian As a Gaussian is defined by iand i, we will have to estimate these parameters from the data We will do this for each class separately, independently of the other classes So we will temporarily drop index i from the formulas
Parameter estimation approaches We will examine two approaches for estimating the parameters Maximum likelihood approach: simpler, more frequently used in practice Bayes approach: theoretically more involved, less frequently used in practice Fortunately, they will give very similar results During classification we will calculate the result in the same way i.e. with the Bayes decision (calculate the likelihood of all classes, then select the most likely one)
Maximum likelihood approach We try to estimate p(x|ci) We assume that the parameters and have concrete values, but they are unknown to us It will select those parameter values that give the best explanation to the data Assigns the highest likelihood value maximum likelihood We could call it maximum probability as well, but not everything between 0 and 1 is a probability
Bayesian approach We try to estimate p(x|ci) AIt treats the parameters not as numbers with missing values, but as stochastic variables that also have a probability distribution 1) we try to model this probability distribution 2) then we use this model to estimate the distribution of data We will first assume an a priori distribution for the parameters, and then refine this model based on the observed data
Maximum Likelihood estimation This is the simplest possible solution If the data indeed has a Gaussian distribution, then it quickly converges to the real parameter values when the amount of training data is increases We will assume that the data in each class has a Gaussian distribution, and we will estimate these separately for each class We will shortly notate the parameters as = ( i, i) The training data set will be shortly denoted by D ( = { x1, , xn} ) We assume that the data samples are independent and identically distributed ( i.i.d. for short)
The Likelihood target function We will seek to maximize the likelihood ( ,..., ) | ( 1 = x P D P n ) = k = ( | ) x P x n k 1 The maximum likelihood estimate of will be that value that maximizes P(D | ) Explanation #1: This is the value by which the likelihood curve gives the best explanation for the data Explanation #2: Consider that when applying the Bayes decision rule, we will select the class for which the likelihood curve gives the largest value. So during training, to increase the chance of correct classification, we seek to achieve the largest possible likelihood value for the samples that belong to the given class (and as low as possible for the others)
The Log-likelihood target function Just as earlier, we will use the logarithmized version of the target function its takes its optimum at the same point, but easier to handle Example: 1D Gaussian, 2is known, we seek the optimal value of 1) The training points and four candidates 2) The likelihood function (as a function of ) and its optimum point 3) The log-likelihood function and its optimum point
Maximizing the log-likelihood We show the optimization process formally first for simpler cases Example: 1D Gaussian, we seek the optimal value for and We want to maximize wrt. = ( 1, 2) = ( , 2) Replacing the variables and taking the logarithm, the log-likelihood function becomes 2 x ( ) 1 1 2 (the exponent is negative) = = arg max | x ( f ) arg max e 2 MLE 2 2
Maximizing the log-likelihood #2 (recap) 2 x ( ) 1 1 2 = = arg max | x ( f ) arg max e 2 MLE 2 2 Using the following: = = arg max | x ( f ) arg max | x ( f ln ) MLE the log-likelihood target function becomes: 1 ) | x ( P ln = = 1 2 ln 2 x ( ) k 2 k 1 2 2 2 xkis a single training example, we can sum up to get this for D i.i.d. assumption and the properties of logarithm
Maximizing the log-likelihood #3 1 1 = = 2 l ln x ( P | ) ln 2 x ( ) At start: k 2 k 1 2 2 2 (ln x ( P | )) k The maximum point is where the derivative is zero: 1 = = l 0 (ln x ( P | )) k 2 1 = x ( ) 0 k 1 2 2 2 2 1 x ( ) so: + = 0 k 1 2 2 2
Maximizing the log-likelihood #4 = 1 k 2 1 n 1 = x ( ) 0 (1) k 1 Summing over all the data points: 2 2 2 n n x ( ) = k = k + = 0 (2) k 1 1 1 2 n = ) 2 ( x After rearranging (and also multiplying by 2): k n x = = = 2 ; k 1 k n n 1 k
Maximizing the log-likelihood #5 That is, we estimate as the mean of the data points, and 2 as their average distance from : n = ) 2 ( x k n x = = = 2 ; k 1 k n n 1 k These values as the so-called sufficient statistics for a normal distribution This means that we don t need the original data values Only these two statistics are enough to estimate the distribution
Multivariate case In the general case the features are vectors So the Gaussian distribution is multivariate We apply the same method setting the derivative of the log-likelihood function to zero But as the function is multivariate, we need to use the gradient operator instead of the univariate derivative So we seek to find: And we apply the gradient operator: = arg max ( l ) t = , ,..., 1 2 p
Maximizing the log-likelihood Applying the gradient operator to the log-likelihood function and summarizing for all examples gives n k = = = l ln x ( P | ) k k 1 And we set l = 0 And the result is (without derivation): = 1 k n = = k n k n 1 1 = k = = ) t x x ( )( x k k k n 1 Very similar to the univariate case! These are just the mean vector and the covariance matrix of the data
Remark #1 The estimate we obtained for 2 (and for ) is biased, because 1 = = n i n 1 n n 2 2 2 ) ( E x i 1 So, in theory, it is better to use the following estimate (for ): = k 1 1 - n = 1 k n = ) t C ( )( x x k k But in practice it doesn t really matter, as when n is large, 1/n 1/(n-1)
Remark #2 In practice the estimate for may turn out to be non-invertible (remember that the formula requires -1) It may happen if there are too few samples or they are very similar (e.g. they are all the same, or differ in a constant multiplier ) Simplest solution: add a small positive value to the diagonal ( stabilize ), so that (C + I) More complex solution: shrinkage estimation During parameter optimization we force the target function to prefer some simpler type of covariance matrix (e.g. diagonal)
Remark #3 In practice we very frequently restrict the covariance matrix to be diagonal In the simplest case by simply ignoring the elements outside the main diagonal Easier to train (less stability problems) Faster to evaluate (no matrix inversion) Of course, the model becomes less accurate (larger model error ) The resulting model is basically equivalent to the Na ve Bayes approach
Bayesian parameter estimation ML approach: has a fixed, but unknown value Bayesian method: is a stochastic value with its own distribution this distribution expresses our uncertainty about the actual value of we are uncertain we have a strong hypothesis (-2) We assume that we know the a priori distribution P( ) Using the D training samples, we are looking for P( | D) -t, the posterior distribution of , which will eventually give us P(x | D)
Bayesian parameter estimation #2 As the final goal, we want to estimate P(x | D), which will be obtained as ( ) ( ) ( P ) = x d P x D P D That is, instead of having a point estimate for , we marginalize over the possible values of the unknown parameter If P( | D)turns out to be pointy , then the result will be very similar to that of the ML method During classification, we use P(x | D) to estimate p(x|ci) D contains only the examples of the given class
Bayesian parameter estimation #3 As earlier we assume that all the distributions have a Gaussian shape, and only their parameters are unknown In practice we can use other distributions as well Notations: ~ ) 2 0 P( N( , ) a priori distribution of (it is known!) 0 ( ) ( ) Posterior distribution of , estimated from n data samples | 2 n P D ~ N , n ~ ) 2 P(x | N( , ) The distribution of x for a given value
Example Example: univariate case (so and 2 are real numbers) 2 is known, we have to estimate only So we will not use the notation in this example Actually we estimate P( |D). First use the Bayes theorem: ) ( P ) | D ( P ) D | ( P = P ( D ) then we assume that the examples are independent: n = k = P ( D | ) x ( P | ) k 1 D ( n P ( D | ) P ( ) = k = = which gives: P ( | D ) x ( P | ) P ( ) k P ) 1
Example #2 n So: (recap) = k = P ( | D ) x ( P | ) P ( ) k 1 And we also assumed that our distribution is Gaussian: , ( N ~ ) D | ( P n 2 n ) (2) The two gives ( after a long struggle) : 2 0 2 n = + n n 0 + + 2 0 2 2 0 2 n n 2 0 2 = 2 n + 2 0 2 n n where is the mean of the training sampes
Discussion nis practically the weighted average of and 0: 2 0 n n n + = n 2 n = + n 0 + + 2 0 2 2 0 2 1 ( ) n n 0 If the sample size n increases, goes to 1, 1- to 0 So we rely more on the estimation based on the data, and rely less on the a priori knowledge The variance of the estimate gets smaller as the sample size n increases So our uncertainty regarding n decreases we are still estimating the a posteriori distribution of 2 0 2 = 2 n + 2 0 2 n
Illustration The numbers correspond to n: With the increase of n, the mean converges to a fixed value The variance gets smaller and smaller, representing that our uncertainty about the actual value decreases
Illustration #2 With the increase of n, the mean converges to a fixed value The variance gets smaller and smaller, representing that our uncertainty about the actual value decreases
Obtaining P(x | D) Now we have P( |D), but we need P(x|D) Recall that: It can be derived that P(x|D) is a normal distribution: ) D | x ( P = D d ) D x ( P | ) x ( P | ) P ( | + 2 2 n ~ N ( , ) n That is, the Bayesian estimate for the expectation will be n while for the variance we get n+ , where is known, and n, expresses the models uncertainty about the estimate (converging to zero as n increases ) In the multivariate case we would obtain very similar results: ( ( N ~ D x P + ) ) n, n For large n it converges to the same estimates as ML optimization!
Bayesian method, general case It can give an estimate for P(x | D) in all cases when we assume some parametric form about the distribution Assumptions: The shape of P(x | ) is known, we seek the exact value We have some a priori knowledge about , represented as P( ) Our remaining knowledge about is represented as n training samples D = { x1, x2, , xn} from P(x) The solution will consist of two steps: (1) we derive P( | D), (2) then we derive P(x | D) -t
Bayesian method, general case #2 For the first step we need the assumption of independence and Bayes formula: ) ( P ) | D ( P ) D | ( P = = k n = D P ( | ) x ( P | ) k P ( D ) = k 1 For the second step we have to calculate: = ( d D D ( | ) ( | ) | ) P x P x P In the general case it is not easy to compute formally In such cases we approximate it numerically (e.g. via Gibbs algorithm), or simply by taking its maximum
Remark The Bayesian method can be straightforwardly applied for adapting our model, if we obtain further training samples


")