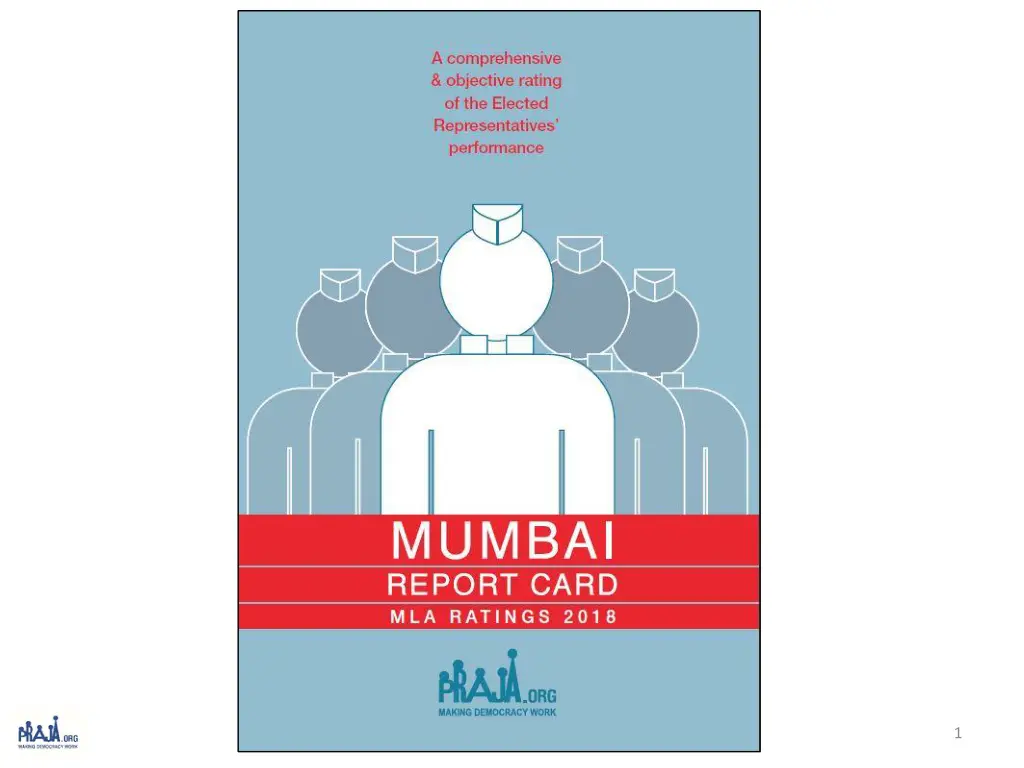
Basis for Monitoring Elected Representatives
"Explore how the Constitution serves as the foundation for monitoring Elected Representatives (ERs) in terms of their powers, responsibilities, and performance. Dive into parameters for rating MLAs and their accountability based on various criteria. Discover trends in the number of questions asked by MLAs and the average scores for quality of life improvement. Stay informed on political dynamics and governance evaluations."

Download Presentation

Please find below an Image/Link to download the presentation.
The content on the website is provided AS IS for your information and personal use only. It may not be sold, licensed, or shared on other websites without obtaining consent from the author. If you encounter any issues during the download, it is possible that the publisher has removed the file from their server.
You are allowed to download the files provided on this website for personal or commercial use, subject to the condition that they are used lawfully. All files are the property of their respective owners.
The content on the website is provided AS IS for your information and personal use only. It may not be sold, licensed, or shared on other websites without obtaining consent from the author.
E N D
Presentation Transcript
The Constitution as a Basis for monitoring of Elected Representatives ERs derive their powers for functioning through the Constitution They are mandated to Attend Sessions, Raise people s Issues, Debate, Participate in Discussions and Pass legislations. The Constitution defines their powers and rules of functioning, hence only the Constitution can provide the parameters for their monitoring. 2
Parameters for Rating MLAs (1/4) Parameter Marks Present1(Attendance, No. & Quality of Questions, Usage of Area Development Fund) Past2(Education qualification, PAN Card, Criminal cases) Perception(through an citizen survey of 24,290 people for their perception on their MLA s accessibility/availability, performance, corruption, and satisfaction with quality of life, services provided by government) Negative for new FIR cases after 2014 election 3 Negative for pending Charge Sheet 3 Total 52 8 40 Minus 5 Minus 5 100 RTI Data Source: 1 Vidhan Bhavan and City & Suburban Collector Offices; 2 Election Commission of India s Website; 3 Mumbai Police. 4
No. of Questions Asked by 32 MLAs Period covered in Report Cards 2011: Winter 09, Budget 10 & Monsoon 10; 2012: Winter 10, Budget 11 & Monsoon 11; 2013:Winter 11, Budget 12 & Monsoon 12; 2014:Winter 12, Budget 13, Monsoon 13 & Winter 13; 2016:Winter 14, Budget 15 & Monsoon 15; 2017: Winter 15, Budget 16 & Monsoon 16; and 2018:Winter 16, Budget 17, GST 17 & Monsoon 17. 8
Average Number of Question Asked by MLAs Ruling Party Opposition Party Term Last term INC(14) + NCP(2) = 16 BJP(5) + MNS(6) + SS(4) + SP(1) = 16 Current Term 9 BJP(12) + SS(13) = 25 INC(5) + SP(1) + AIMIM(1) = 7
Average Score & Improvement in Quality of Life In 2015, because it was the first year of the MLAs new term, they were not ranked 10
Key Insights The average score of Attendance of members of legislative assembly (MLAs) in Mumbai has reduced by 10.63% from 91.88% in the report card of 2017 (Winter 15, Budget 16 & Monsoon 16) to 81.25% in 2018 (Winter 16, Budget 17, GST 17 & Monsoon 17). Accessibility of MLAs has increased from 45.55% in 2017 to 53.31% in 2018. The quality of questions is on a decreasing trend too. It has significantly dropped from 58.49% in 2016 to 38.18% & 38.36% in 2017 & 2018 respectively. 11
MLAs with criminal cases as per Representative of People s Act 1951 53% (19 out of 36) MLAs have criminal cases (FIRs) registered against them. There is an 8% increase in the charge-sheets against MLAs. In the report card of 2018, 16 MLAs (44%) have charge- sheets against them, in comparison to 13 MLAs (36%) in 2017. Note: This data includes all four designated ministers along with 32 MLAs. 12
Note: Scores for the corresponding year (2013) in the last term have been given for comparison with the current year (2018). 13
Party wise Ranking in 2018 Average Score 54.59 59.92 68.22 48.37 56.58 Average Rank 23 15 8 26 19 Political Party AIMIM (1) BJP (12) INC (5) SP (1) SS (13) 14
2017 2018 Party INC SS BJP SS INC BJP BJP BJP INC BJP SS BJP INC INC SS BJP SS SS BJP BJP BJP SS AIMIM SS SS SP SS SS SS SS BJP BJP MLAs Name Score 78.25 73.17 72.79 69.26 74.12 68.32 70.20 68.56 72.28 62.52 57.84 65.84 73.87 74.93 56.94 58.20 59.15 52.63 57.54 60.79 53.91 55.83 51.24 44.70 59.81 58.46 48.11 46.50 51.41 51.65 46.18 41.96 Rank 1 5 6 9 3 11 8 10 7 13 19 12 4 2 21 18 16 24 20 14 23 22 27 31 15 17 28 29 26 25 30 32 Score 76.45 75.61 74.67 72.69 72.31 70.94 66.90 66.16 65.97 65.95 64.91 64.60 63.43 62.93 62.30 61.20 60.55 59.35 58.25 57.82 57.46 54.73 54.59 52.39 48.68 48.37 48.24 46.48 45.36 44.27 41.74 33.37 Rank 1 2 3 4 5 6 7 8 9 10 11 12 13 14 15 16 17 18 19 20 21 22 23 24 25 26 27 28 29 30 31 32 Amin Amir Ali Patel Sunil Waman Prabhu Atul Bhatkhalkar Sunil Govind Shinde Aslam Ramazan Ali Shaikh Manisha Ashok Chaudhary Yogesh Sagar Ashish Babaji Shelar Varsha Eknath Gaikwad Ameet Bhaskar Satam Trupti Prakash Sawant Sardar Tara Singh Md. Arif (Naseem) Lalan Khan Kalidas Nilkanth Kolambkar Prakash Vaikunt Phaterpekar Mangal Prabhat Lodha Ajay Vinayak Choudhari Prakash Rajaram Surve Parag Madhusudan Alavani Raj Purohit Bharati Hemant Lavekar Mangesh Anant Kudalkar Waris Yusuf Pathan Tukaram Ramkrishna Kate Sunil Rajaram Raut Abu Asim Azmi Ramesh Kondiram Latke Ashok Dharmaraj Patil Sadanand Shankar Sarvankar Sanjay Govind Potnis Selvan R. Tamil Ramchandra Shivaji Kadam 15
THANK YOU!!! 16


")


 in the last")


![Guardians of Collection Enhancing Your Trading Card Experience with the Explorer Sleeve Bundle [4-pack]](/thumb/3698/guardians-of-collection-enhancing-your-trading-card-experience-with-the-explorer-sleeve-bundle-4-pack.jpg)