Battery Market Dynamics and Insights
"The 36th International Conference of the System Dynamics Society in Reykjavik, Iceland, delves into the battery market for electric cars, addressing current challenges and future projections. Explore the global transition towards electric vehicles, potential supply-side constraints, and the dynamic factors influencing purchase decisions and industry growth."

Download Presentation

Please find below an Image/Link to download the presentation.
The content on the website is provided AS IS for your information and personal use only. It may not be sold, licensed, or shared on other websites without obtaining consent from the author.If you encounter any issues during the download, it is possible that the publisher has removed the file from their server.
You are allowed to download the files provided on this website for personal or commercial use, subject to the condition that they are used lawfully. All files are the property of their respective owners.
The content on the website is provided AS IS for your information and personal use only. It may not be sold, licensed, or shared on other websites without obtaining consent from the author.
E N D
Presentation Transcript
THE 36TH INTERNATIONAL CONFERENCE OF THE SYSTEM DYNAMICS SOCIETY REYKJAV K, ICELAND Exploring the Battery Market for Electric Cars Jonatan G mez Vilchez, Joint Research Centre The views expressed are purely those of the presenter and may not in any circumstance be regarded as stating an official position of the European Commission
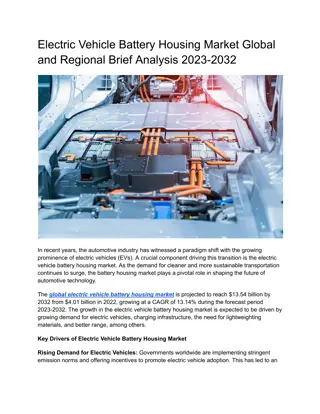
Problem Statement Over 3 million electric cars in use worldwide in 2017 (EVI, 2018) Goal: 100 million electric cars globally in 2030 (COP21, 2016) Potential supply-side constraints neglected Resource scarcity Supply chain bottlenecks
Approach or Dynamic Hypothesis Purchase Decision + + Combined Utility + Willingness to Consider R1 - + + Sales (New Reg's) + Total Cost of Ownership + Attractiveness R2 B1 + Newer Cars Lower Taxes Marketing Against Penalties + Fuel & Recharging Price + R2 Price + + + Marketing Taxes + + Forecast Sales R2 + Costs R1 R3 New Vehicle Emissions - + Research Drives Attractiveness + - R3 R&D Accrued and Forecast Emissions Penalties + Investment Newer Cars Lower Penalties Performance Metrices + + Forecast New Vehicle Emissions
Progress and Insights to Share Battery market dynamics disruptive Selected Variables 200 150 EVB manufacturing capacity 10 GW*h/Year 100 7.5 GW*h/Year 5 50 2.5 0 0 1996 1996 2006 2016 2026 2036 2046 2006 2016 2026 2036 2046 Time (Year) Time (Year) EVB manufacturing capacity[CHINA] : Current EVB manufacturing capacity[EU] : Current EVB manufacturing capacity[JAPAN] : Current EVB manufacturing capacity[SKOREA] : Current EVB manufacturing capacity[US] : Current global EVB manufacturing capacity : Current with plans global EVB manufacturing capacity : Current with demand global EVB manufacturing capacity : Current world EVB demand : Current with demand Source: own assumptions based on Lebedeva et al. (2016) and DB (2016)
References 1. COP21 (2016) Paris Declaration on Electro-Mobility and Climate Change and Call to Action - Electrifying Sustainable Transport, 21st Conference of the Parties (COP). Available at: http://newsroom.unfccc.int/lpaa/transport/the-paris-declaration-on- electro-mobility-and-climate-change-and-call-to-action/ 2. DB (2016) EV battery makers. Market research. Deutsche Bank (DB) 3. EVI (2018) Global EV Outlook 2017. Electric Vehicles Initiative (EVI) 4. Lebedeva, N., Di Persio, F., Brett, L. (2016) Lithium ion battery value chain and related opportunities for Europe. Publications Office of the European Union I thank Sebastiaan Deuten for his Causal Loop Diagram on slide #3.