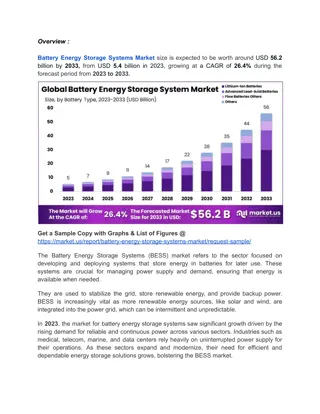
Battery Storage Capacity Contribution for CDR
Dive into ongoing research on storage capacity contribution for CDR supply analysis. Discover findings from studies by NREL, LBNL, EPRI, and ICF, shedding light on factors influencing storage duration and potential peaking capacity with solar integration.

Download Presentation

Please find below an Image/Link to download the presentation.
The content on the website is provided AS IS for your information and personal use only. It may not be sold, licensed, or shared on other websites without obtaining consent from the author. If you encounter any issues during the download, it is possible that the publisher has removed the file from their server.
You are allowed to download the files provided on this website for personal or commercial use, subject to the condition that they are used lawfully. All files are the property of their respective owners.
The content on the website is provided AS IS for your information and personal use only. It may not be sold, licensed, or shared on other websites without obtaining consent from the author.
E N D
Presentation Transcript
Battery Storage Capacity Contribution for CDR Supply Analysis Working Group Julia Matevosyan Resource Adequacy February 20, 2020
Outline and Key Points Storage capacity contribution is still a topic of ongoing research ERCOT has reviewed storage capacity contribution studies carried out by the National Renewable Energy Laboratory (NREL), Lawrence Berkeley National Laboratory (LBNL), Electric Power Research Institute (EPRI) and ICF International (ICF) NREL s, EPRI s and ICF s studies all included ERCOT system as one of their test cases Even though the methods used in the studies are different, the conclusions are generally very similar 2 PUBLIC
Research Study Findings (NREL, LBNL, EPRI, ICF) Storage capacity contribution depends on its duration and intended use (i.e. AS or energy arbitrage or both) Storage duration is determined as maximum energy divided by maximum discharge capacity. Storage with sufficient duration is expected to contribute with 100 % capacity over peak net load hours, since these will be the hours with the highest prices. The width of the net load peak is system-specific but as more storage is added to a system the width of peak net load will increase. Thus, for storage of a given duration there will be a maximum installed capacity after which it is no longer contributing 100% over the entire duration of the net load peak. 3 PUBLIC
NRELs Study: The Potential for Battery Energy Storage to Provide Peaking Capacity in the United States Peaking capacity potential is a function of region s load shape 4-hour storage typically works best in strongly summer peaking systems with narrow peaks Ability of 4-hour storage to reduce peak demand drops as net demand shape widens Source: NREL 4 PUBLIC
Peaking Capacity Potential is a Function of Regions Load Shape Source: NREL 5 PUBLIC
Adding Solar may Increase Storages Potential to Provide 100% Capacity over Net Load Peak Adding solar tends to narrow period of peak demand, potentially increasing the ability of 4-hour storage to act as peaking capacity The practical potential of 4-hour storage increases as a function of PV deployment in all regions, but with a variety of regional patterns 10% PV 5% PV Zero PV Source: NREL 6 PUBLIC
The Potential for Storage to Provide Peaking Capacity in ERCOT at Different Levels of Solar and Wind Source: NREL 7 PUBLIC
Current Situation ERCOT currently uses 0% capacity contribution for battery storage ERCOT currently does not collect data on storage duration (h) or maximum energy (MWh). This data will be available once BESTF-5 NPRR Energy Storage Resource Single Model Registration (based on KTC-1) is approved and implemented in RIOO-IS, and Resource Entities update their resource information. This may take 2+ years. Based on 01/31/2020 GIS Report: 124 MW of installed battery storage capacity 402 MW with SGIA and Financial Security Posted 5.4 GW of battery storage (with FIS started) in the interconnection queue with COD before the end of 2022. 8 PUBLIC
Proposed Way Forward: Interim Solution To start including storage in the CDR, ERCOT needs storage MWh and duration information prior to BESTF-5 NPRR implementation. EIA data? RFI? Both? Using this data, ERCOT will include storage in the CDR Resource Scenario Analysis tab, where net load peak hours are considered; ESRs will continue to be excluded from Reserve Margin calculations. Using historic data, ERCOT will be calculating historic average capacity contributions across peak load hours and net load peak hours, similarly to wind and solar. 9 PUBLIC
Proposed Way Forward: Long Term Solution Once BESTF-5 NPRR is implemented and Resource Entities provide their ESR duration information, ERCOT will start using this data for CDR Reserve Margin calculation purposes ERCOT will file an NPRR documenting the methodology for calculating storage capacity contribution Using historic data, ERCOT will be calculating historic average capacity contributions across peak load hours and net load peak hours, similarly to wind and solar. ERCOT then adjust the capacity contribution of storage in accordance with historic performance 10 PUBLIC
References EPRI: Energy Storage Capacity Value Estimation, Report 3002013957, January 2019, http://membercenter.epri.com/abstracts/Pages/ProductAbstract.aspx?P roductId=000000003002013491 NREL: The Potential for Battery Energy Storage to Provide Peaking Capacity in the United States, Report, June 2019, https://www.nrel.gov/docs/fy19osti/74184.pdf LNBL: Drivers of the Resource Adequacy Contribution of Solar and Storage for Florida Municipal Utilities, October 2019, https://emp.lbl.gov/publications/drivers-resource-adequacy ICF: Unlocking the Hidden (Capacity) Value in Energy Storage, Whitepaper, 2016 https://www.icf.com/insights/energy/unlocking-the- hidden-capacity-value-in-energy-storage 11 PUBLIC
Thank you! Questions? Julia Matevosyan jmatevosjana@ercot.com PUBLIC
ERCOT: 2018 Form EIA-860 Data - Schedule 3, 'Energy Storage Data' (Operable Units Only) Nameplate Energy Capacity (MWh) Maximum Charge Rate (MW) Maximum Discharge Rate (MW) Nameplate Capacity (MW) Operating Year Calculated Duration (h) Plant Name County Notrees Windpower Pyron Wind Farm LLC Inadale Wind Farm LLC OCI Alamo Solar I ETT Presidio NaS Battery Blue Summit Storage, LLC NRG Elbow Creek Energy Storage Kingsberry Energy Storage System Travis Ector Fisher Nolan Bexar Presidio Wilbarger Howard 36 9.9 9.9 1 4 30 2 1.5 2012 2018 2018 2016 2010 2017 2017 2018 13.6 9.9 9.9 0.3 4 12.6 0.7 3 36 9.9 9.9 1 4 30 2 1.5 36 9.9 9.9 1 4 30 2 1.5 0.4 1 1 0.3 1 0.4 0.4 2 Note: Duration (h) is calculated as Energy Capacity (MWh)/Maximum Discharge Rate (MW) and is not part of Form EIA 860 Data 13 PUBLIC


")