Bayesian Approaches to Testing a Point Null Hypothesis
In the realm of empirical research, Bayesian approaches offer estimation and model comparison methods to address hypotheses. Kruschke and the Amsterdam group present distinct viewpoints on Bayesian data analysis using tools like JASP, R, JAGS, and Stan. Understanding the estimation approach and the model comparison approach can enhance research practices in psychology and beyond.

Uploaded on Feb 20, 2025 | 4 Views
Download Presentation

Please find below an Image/Link to download the presentation.
The content on the website is provided AS IS for your information and personal use only. It may not be sold, licensed, or shared on other websites without obtaining consent from the author.If you encounter any issues during the download, it is possible that the publisher has removed the file from their server.
You are allowed to download the files provided on this website for personal or commercial use, subject to the condition that they are used lawfully. All files are the property of their respective owners.
The content on the website is provided AS IS for your information and personal use only. It may not be sold, licensed, or shared on other websites without obtaining consent from the author.
E N D
Presentation Transcript
Bayesian Approaches to Testing a Point ( Null ) Hypothesis Chapter 12 of Kruschke text Darrell A. Worthy Texas A&M University
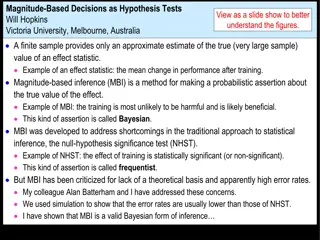
Bayesian Approaches If we think NHST has some flaws that s fine, but we re in the business of conducting and publishing empirical research so what can we use from the Bayesian toolbox to answer questions about our hypotheses? There are two approaches we can take (currently) One is the estimation approach which asks whether the value of interest, like a null , falls among the most credible values. The other is the model comparison approach between a model that only allows a prior distribution that includes the parameter of interest versus a prior distribution that includes a broad range of possible values. This approach uses Bayes Factors to quantify evidence for the null or the alternative hypotheses.
Bayesian Approaches In Psychology the estimation approach is the one favored by Kruschke The model comparison approach is championed by a group that includes E.J. Wagenmakers, Jeff Rouder, Richard Morey as well Dora Matzke, Jonathon Love, Helen Steingroever and others. I will use Kruschke s chapter to introduce the estimation approach and articles from Wagenmakers and colleagues to introduce the model comparison approach. Kruschke has a textbook and has written high level R scripts for researchers to use R, JAGS, and Stan to conduct Bayesian analyses. There are chapters devoted to using R, Jags and Stan as well as the second half of the book which has chapters devoted to tests from the GLM.
Bayesian Approaches I will call the latter group the Amsterdam group even though Rouder is at Missouri and Morey is at Cardiff because the University of Amsterdam has generously sponsored JASP, which is a free software that has a spreadsheet interface like SPSS. I believe JASP stands for Just Another Stats Program, similar to JAGS. The Amsterdam group does not have a textbook that I know of, but their statistic package JASP is a much easier entry point for conducting Bayesian data analysis. In the hands on portion of the course I will focus on analyzing data with JASP, and thus this course is more biased toward the model comparison approach where the Bayes Factor can replace the p value. I will also show some examples using JAGS via R from high-level scripts that Kruschke has written that are easy to use. If there is a Part 2 to this course we will cover other topics in more detail and focus more on code-based analyses through R, JAGS, and Stan.
The Estimation Approach Recall the example of using Bayesian inference to derive a posterior distribution over a parameter of interest, such as the bias of a coin. We can use the posterior distribution to discern the credible values of the parameter. If the null value is far from the credible values, then we reject the null value as not credible. If all credible values are virtually equivalent to the null value, then we can accept the null value. This intuitive decision is what we do when we use the estimation approach.
The Estimation Approach A region of practical equivalence (ROPE) indicates a small range of parameter values that are considered to be practically equivalent to the null value. For example, if we wonder whether a coin is fair, then we want to know whether the underlying bias of the coin is reasonably close to .50, and we don t really care if the true bias is .473 or .528. The ROPE might be set between .45 to .55 in that case. Alternatively if we are comparing the efficacy of a drug vs. placebo then we might only consider using the drug if it improves the probability of a cure by at least 5%. The ROPE on the difference of cure probabilities could have limits from -.05 to .05.
The Estimation Approach Once a ROPE is set we make a decision to reject a null value according to the following rule: A parameter is declared to be not credible, or rejected, if its entire ROPE lies outside the 95% HDI of the posterior distribution of that parameter. For example, if we flip a coin 500 times and observe 325 heads we might get a 95% HDI from .608 to .691. This falls well outside the ROPE from .45 to .55, therefore we declare that the null is rejected, or not credible. Note that when the HDI excluded the ROPE we rejected the null value rather than all values within the ROPE.
The Estimation Approach Because the ROPE and HDI can overlap in different ways, there are different decisions that can be made. We can decide to accept a null value according to this rule: A parameter value is declared to be accepted for practical purposes if that value s ROPE completely contains the 95% HDI of the posterior of that parameter. With this decision rule there must be sufficient precision in the estimate of the parameter. For example if we flip a coin 1000 times and observe 490 heads, we would have a 95% HDI from .459 to .521, which is within the ROPE.
The Estimation Approach When the HDI and the ROPE overlap, with some of the HDI falling outside the ROPE, then we withhold a decision. This merely means that the data are insufficient to support a conclusion one way or another. Note that the posterior distribution provides complete information about the credible parameter values, regardless of the binary reject- don t reject decision. Aside from its intuitive appeal using the ROPE allows us to affirm a predicted value like the null, rather than just failing to reject it.
The Estimation Approach How is the size of the ROPE determined? This is not an easy question and the limits depend on the practical purpose of the ROPE. The ROPE limits by definition cannot be uniquely correct, but instead are established by practical aims, bearing in mind that wider ROPEs yield more decisions to accept the null and narrower limits yield more decisions to reject the null. In many situations the exact limit of the ROPE can be left tacit, and the 95% HDI reported, so that the audience can use whatever ROPE they feel is appropriate.
The Estimation Approach An example from Kruschke Chapter 16: Say we gave one group of people a smart drug to test its effect on IQ. We want to compare against a placebo group. Kruschke gives Stan and JAGS code for these and all analyses They are in the DBDA2Eprograms folder for this course. Plotted below are the posterior distributions estimating mean IQ scores for each group:
The Estimation Approach We can compute the difference of means ( ) and set a ROPE on this difference between -.5 and .5, indicating that a half point difference from zero is practically equivalent. We can see that the expected difference in IQ between the smart drug and placebo is 7.74. The 95% HDI is barely outside of the ROPE It appears that a difference in IQ of 0 between groups is not credible.
The Estimation Approach We can also examine the posterior distribution for the effect size (Cohen s d). The mode of .523 suggests a non-zero difference, but the ROPE between -.1 and .1 includes a small amount of the 95% HDI. The green text tells us 99.3% of the posterior distribution is greater than 0 The red text gives the same information for areas around and within the ROPE.
The Estimation Approach Interestingly, if we used a NHST approach of using a traditional t-test we would obtain a p-value of .05273. This is greater than .05 so the conventional decision would be to not reject the null. The reason the t-test is less sensitive than the Bayesian estimation in this example is that the t-test assumes normality. In this case there are a few outliers that make the t-test s estimate of within group variance larger than it would otherwise be. Large within group variance can lead to increased risk of Type 2 errors.
The Estimation Approach For the estimation approach the main thing that s important is to know how to apply the 95% HDI. The Amsterdam group uses the term credible interval which means the same thing. You can interpret the 95% HDI similarly to a 95% confidence interval, by for example, just examining whether the HDI for a parameter like effect size includes zero. However, adding a reasonable ROPE is probably also necessary if you are exclusively using the estimation approach and are not reporting Bayes Factors from a model comparison.
The Model-Comparison Approach Researchers advocating the model-comparison approach prefer to pose the question in terms of model comparison. Here the focus is on deciding which of two hypothetical prior distributions is least (or most) credible. One prior expresses the hypothesis that the parameter value is exactly the null value. The alternative prior expresses the hypothesis that the parameter could be any value, according to some broad distribution. As a concrete and practical alternative to NHST using p values, the Amsterdam group proposes hypothesis testing using Bayes factors.
The Model-Comparison Approach The Bayes factor approach has been championed by prominent scientists such as Sir Harold Jeffreys (1961), E.T. Jaynes (1996) and Kass and Rafferty (1995). The Bayes factor hypothesis test compares the predictive accuracy of two competing statistical models. It grades the evidence provided by the data on a continuous scale. It also quantifies the change in belief that the data bring about for the two models under consideration. Bayes factors allow researchers to quantify evidence, and allow it to be monitored as data accumulate, without needing to know the intentions of the researcher.
The Model-Comparison Approach To facilitate exposition consider an example where we are interested in examining the height advantage of US presidential candidates. We are trying to predict the proportion of the population vote the president received in all 46 US elections from the ratio of height between each candidate and their competitor. We are interested in inferring the posterior probability distribution of from the data.
The Model-Comparison Approach The uncertainty about before seeing the data is specified by a default prior distribution that stipulates that every value of is equally possible (Jeffreys, 1961). This would be a uniform distribution from -1 to 1 shown by the dashed line. Next the prior distribution is combined with the likelihood from the data, yielding the posterior distribution of
The Model Comparison Approach In Bayesian parameter estimation the inferential end-goal is the posterior distribution. However, Bayes factor advocates argue that we cannot use this distribution alone for hypothesis testing. The uniform prior presupposes that is relevant (not zero). To test the hypothesis that H0: =0 we have to take that possibility serious when establishing our prior beliefs. This is a criticism of the estimation approach To answer the question: To what extent do the data support the presence of a correlation we need compare models that assume a null versus an alternative hypothesis.
The Model Comparison Approach Once we ve established H0 and H1the process of updating their relative plausibilities is described by a simplification of Bayes rule: Here the prior model odds indicate the relative plausibility of the two models beforehand. After observing the data, the relative plausibility is quantified by the posterior model odds. The change from prior to posterior odds brought about by the data, also known as the likelihood, is referred to as the Bayes factor.
Bayes factor Because of the subjective nature of the prior model odds, the emphasis of Bayesian hypothesis testing is on the amount by which the data shift one s beliefs. That is, on the Bayes factor. Bayes factors are interpreted like odds. When the Bayes factor BF10 = 6.33, the data are 6.33 times more likely under H1than under H0. When the Bayes factor BF10 = .2 the data are five times more likely under H0than under H1.
Bayes factor Sir Harold Jeffreys work in his 1935 and 1961 papers and his book Theory of Probability developed much of our current uses of Bayes factors. Kass and Rafferty s 1995 paper built on Jeffreys work by exploring the use of the Bayes factor as a practical tool of applied statistics. E.T. Jaynes textbook Probability Theory: The Logic of Science is dedicated to Jeffreys. It reads: Dedicated to Sir Harold Jeffreys, who saw the truth and preserved it.
Bayes Factor From Jeffreys Bayesian viewpoint, the purpose of hypothesis testing is to evaluate the evidence in favor of a scientific theory. Bayes factors allow the researcher to grade the evidence provided by the data on a continuous scale. A Bayes factor of 3 or greater indicates substantial evidence for the alternative hypothesis. This would be somewhat analogous to p<.05 (or p<.01 as we will see). Bayes factors give information beyond the dichotomous choice of the hypothesis test.
Bayes Factor Wetzels and colleagues (2011) examined the associations between p values, effect sizes and Bayes factors for 855 published t-tests. 69% of tests were significant at p<.05, whereas only 53% of studies received substantial or greater support according to Bayes factors.
Bayes Factor 70% of studies with p values between .01 and .05 received anecdotal support barely worth a mention according to the Bayes factor. They also noted that effect size provides additional information beyond what p values of Bayes factors tell us.
Bayesian Approaches to NHST There is some debate over whether the parameter estimation or model comparison approach is better. I have focused on the strengths noted by Kruschke and Wagenmakers and colleagues for their favored approaches. In the Kruschke text and in the Bayesian Inference for Psychology articles in the course folder they each offer some criticisms of the approach they do not favor. In the hands on portion of the course we will focus more on the model comparison approach using Bayes factors in JASP. We will also conduct some analyses using Kruschke s JAGS/R scripts.
Bayesian Approaches to NHST JASP currently offers the easiest entry point for doing Bayesian data analysis and is what we will focus first on tomorrow. We will be able to conduct hypothesis testing using Bayes factors from JASP for most analyses our field conducts that are based on the General Linear Model. JASP is only a couple years old, however, and does not currently provide things that Kruschke s Stan and JAGS scripts do. For example, JASP currently does not give posterior distributions for all model parameters (like all regression coefficients). Kruschke s Stan and JAGS scripts give posterior distributions for each parameter, but do not have the easy model-comparison statistics that Bayes factors provide.