Bethel Study 2018 Results: Trends in Affordability & Financial Health at CCCU Schools
Explore the key findings from the 2018 Bethel Study, focusing on trends in affordability, institutional financial health, and insights for CCCU institutions. Discover information on survey participants, affordability indicators, financial health indicators, implications for schools, and more.

Download Presentation

Please find below an Image/Link to download the presentation.
The content on the website is provided AS IS for your information and personal use only. It may not be sold, licensed, or shared on other websites without obtaining consent from the author. If you encounter any issues during the download, it is possible that the publisher has removed the file from their server.
You are allowed to download the files provided on this website for personal or commercial use, subject to the condition that they are used lawfully. All files are the property of their respective owners.
The content on the website is provided AS IS for your information and personal use only. It may not be sold, licensed, or shared on other websites without obtaining consent from the author.
E N D
Presentation Transcript
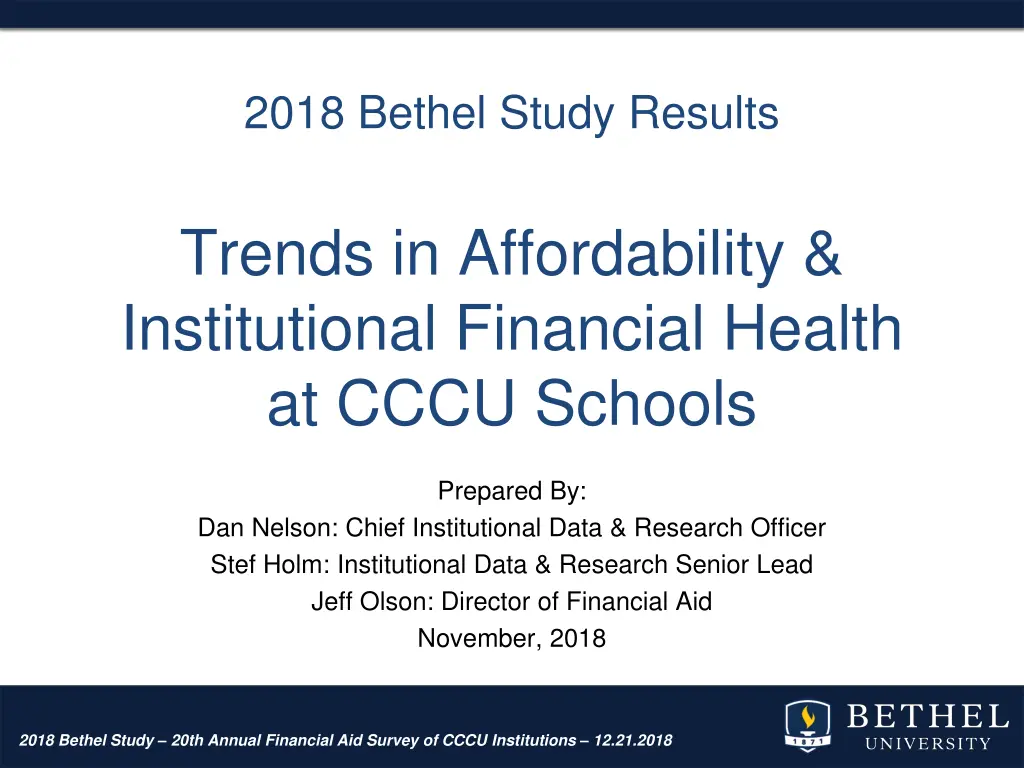
2018 Bethel Study Results Trends in Affordability & Institutional Financial Health at CCCU Schools Prepared By: Dan Nelson: Chief Institutional Data & Research Officer Stef Holm: Institutional Data & Research Senior Lead Jeff Olson: Director of Financial Aid November, 2018 2018 Bethel Study 20th Annual Financial Aid Survey of CCCU Institutions 12.21.2018
Authors Stef Holm Jeff Olson Dan Nelson 2018 Bethel Study 20th Annual Financial Aid Survey of CCCU Institutions 12.21.2018
Presentation Overview 1. Survey Participants Survey Demographics Enrollment Packaging Competitors 3. Affordability Indicators Cost of Attendance Budgets Financial Aid Student Debt Net Price / Family Ability to Pay 2. Financial Health Indicators Tuition & Fee Revenue Discount Rates Need Wealth Index Net Tuition Revenue 4. Implications for our Schools (discussion) 2018 Bethel Study 20th Annual Financial Aid Survey of CCCU Institutions 12.21.2018
Survey Participants Survey Demographics Enrollment Packaging Competitors 2018 Bethel Study 20th Annual Financial Aid Survey of CCCU Institutions 12.21.2018 4
62 Participants Nov. 18 http://batchgeo.com/ 2018 Bethel Study 20th Annual Financial Aid Survey of CCCU Institutions 12.21.2018
51 Schools Participated in at least 5 of the last 6 Surveys 135 schools participated in at least 1 survey Arizona Chr. Univ., AZ Asbury Univ., KY Bethel Univ., MN* Biola Univ., CA Bluefield Coll., VA Calvin Coll., MI* Campbellsville Univ., KY Colorado Chr. Univ., CO Columbia Internat. Univ., SC Corban Univ., OR Cornerstone Univ., MI Crown Coll., MN Dordt Coll., IA Emmanuel Coll., GA Evangel Univ., MO Fresno Pacific Univ., CA Geneva Coll, PA George Fox Univ., OR Gordon Coll., MA Grace Coll., IN Greenville Coll., IL Hope International Univ., CA Houghton Coll., NY* Huntington Univ., IN Indiana Wesleyan Univ., IN John Brown Univ., AR* Lee Univ., TN LeTourneau Univ., TX Lincoln Chr. Univ., IL Lipscomb Univ., TN Messiah Coll., PA* MidAmerica Nazarene Univ., KS Milligan Coll., TN Moody Bible Institute, IL Nyack Coll., NY Oklahoma Baptist Univ., OK Oklahoma Chr. Univ., OK Olivet Nazarene Univ., IL Point Loma Nazarene Univ., CA Roberts Wesleyan Coll., NY* Simpson Univ., CA Spring Arbor Univ., MI Sterling Coll., KS Taylor Univ., IN* Trevecca Nazarene Univ., TN Trinity Chr. Coll., IL Univ. of Northwestern, MN* Warner Pacific Coll., OR Westmont Coll., CA* Wheaton Coll., IL William Jessup Univ., CA 2018 Bethel Study 20th Annual Financial Aid Survey of CCCU Institutions 12.21.2018
2017-18 Enrollment (see p. 4) Of the 62 respondents: 49 (79%) report non-traditional undergrads 56 (90%) report graduate students Total Fall 17 undergraduate enrollment in traditional programs was 102,881 (for the 62 reporting schools). Total year grad and undergrad enrollment was 206,922 (as reported on FISAP) 2018 Bethel Study 20th Annual Financial Aid Survey of CCCU Institutions 12.21.2018
Traditional Undergraduate Programs Traditional Undergraduate Enrollment 7,000 6,000 5,498 5,000 4,530 4,000 3,000 2,345 2,000 1,996 1,662 1,379 1,620 1,316 1,000 945 813 348 177 0 2008-09 2009-10 2010-11 2011-12 2012-13 2013-14 2014-15 2015-16 2016-17 2017-18 Minimum Average (mean) First Quartile Second Quartile (median) Third Quartile Fourth Quartile (maximum) 2018 Bethel Study 20th Annual Financial Aid Survey of CCCU Institutions 12.21.2018
Other Undergraduate Enrollment 1,000 905 900 800 768 759 700 617 600 500 400 393 333 300 286 200 163 100 0 2008-09 2009-10 2010-11 2011-12 2012-13 2013-14 2014-15 2015-16 2016-17 2017-18 First Quartile Second Quartile (median) Third Quartile Average (mean) 2018 Bethel Study 20th Annual Financial Aid Survey of CCCU Institutions 12.21.2018
Graduate Enrollment 1,400 1,200 1,174 1,073 1,000 969 802 800 600 442 400 338 200 198 177 0 2008-09 2009-10 2010-11 2011-12 2012-13 2013-14 2014-15 2015-16 2016-17 2017-18 First Quartile Second Quartile (median) Average (mean) Third Quartile 2018 Bethel Study 20th Annual Financial Aid Survey of CCCU Institutions 12.21.2018 10
Total Enrollment - All Respondents 100% 90% 80% 70% 60% 50% 40% 30% 20% 10% 0% 2008-09 2009-10 2010-11 2011-12 2012-13 2013-14 2014-15 2015-16 2016-17 2017-18 Grad Enrollment 43,840 52,491 60,633 62,954 63,160 61,787 64,377 45,598 48,718 66,547 Other Undergrad Enrollment 37,747 42,527 46,571 51,439 46,293 44,675 40,924 34,961 32,366 37,608 Traditional Undergrad Enrollment 102,192 108,813 120,503 129,805 133,857 127,610 124,456 101,453 100,169 103,046 2018 Bethel Study 20th Annual Financial Aid Survey of CCCU Institutions 12.21.2018 11
Traditional Undergraduate Programs % of Institutionally Controlled Gift Aid (ICGA) (p. 242ff.) 100% 90% 80% 70% 60% 50% 40% 30% 20% 10% 0% Awarded for Merit or Circumstance; Exceeds Need Awarded for Merit or Circumstance; Meets Need Awarded for Need & Meets Need Q. Under your current policy, what percent of institutionally controlled gift aid (excluding tuition remission) is awarded based on need, or awarded for Merit/Circumstance, and used to meet need, or awarded for Merit/Circumstance above need? 2018 Bethel Study 20th Annual Financial Aid Survey of CCCU Institutions 12.21.2018 12
Frequently Named Competitors(p. 254ff.) # Times Listed as Competitor Type of Competition? 12 Azusa Pacific University, CA 10 Biola University, CA 9 Wheaton College, IL 8 California Baptist University, CA 6 George Fox University, OR 6 Indiana Wesleyan University-Marion, IN 5 Bethel University, MN 5 Westmont College, CA 5 Olivet Nazarene University, IL 5 Calvin College, MI 5 Dordt College, IA 5 Whitworth University, WA CCCU 2017-18 = 39% 2013-14 = 41% 2009-10 = 42% Other Private 2017-18 = 21% 2013-14 = 20% 2009-10 = 21% Publics 2017-18 = 40% 2013-14 = 39% 2009-10 = 37% 46% of responding schools identified a public institution as their #1 competitor (24/52) Q. Who are your top 7-10 competitors (in traditional undergraduate programs)? 2018 Bethel Study 20th Annual Financial Aid Survey of CCCU Institutions 12.21.2018 13
Financial Health Indicators: Institution Perspective Tuition & Fee Revenue Discount Rates Need Wealth Index Net Tuition Revenue 2018 Bethel Study 20th Annual Financial Aid Survey of CCCU Institutions 12.21.2018 14
Tuition and Fee Revenue (see p. 18) Non- The 62 responding schools reported 17- 18 tuition & fee revenue of $3.89 Billion Traditional Programs Graduate Programs Year Traditional Programs 08- 09 09-10 10- 11 11- 12 12- 13 13- 14 14- 15 15- 16 16- 17 17- 18 81.6% 79.5% 79.1% 78.5% 80.2% 80.5% 78.8% 79.3% 79.6% 74.1% 8.9% 9.3% 8.8% 10.0% 8.2% 8.5% 8.8% 8.5% 7.3% 6.9% 9.5% 11.3% 12.1% 11.5% 11.6% 11.0% 12.4% 12.2% 13.1% 19.0% Extrapolating to the entire CCCU membership, tuition & fee revenue at CCCU schools is over $6 Billion annually. 2018 Bethel Study 20th Annual Financial Aid Survey of CCCU Institutions 12.21.2018 15
Traditional Undergraduate Programs How Dependent are Schools on Student and Family Loans? (see p. 63) Recorded loans (including PLUS) exceed 50% of tuition & fee revenue at only 2 of 62 reporting schools (3%) 2% on 2017 survey Loans are less than 30% of tuition and fee revenue at 39 of 62 schools (63%) 52% on 2017 survey The median percentage is 27.6%, compared with 29.3% on 2017 survey 31.0% on 2016 survey 32.9% on 2015 survey 2018 Bethel Study 20th Annual Financial Aid Survey of CCCU Institutions 12.21.2018
Traditional Undergraduate Programs Percentage of 2017-18 Institutional Gift Aid (IGA) that is funded (see p. 43) The typical (median) school reports that 3.9% of institutional gift aid (not including tuition remission) has a specific funding source (endowed or restricted). 3 schools report that over 15% of IGA is funded. 9 schools report between 10-15% of IGA is funded 15 schools report between 5.0-9.9% of IGA is funded 35 schools report that less than 5% of IGA is funded 2018 Bethel Study 20th Annual Financial Aid Survey of CCCU Institutions 12.21.2018
Discount Rate Calculation Unfunded "Unrestricted Institutional gift aid" divided by "tuition and fee revenue" NACUBO (Unrestricted institutional gift aid + endowed + restricted) divided by "tuition and fee revenue" Neither calculation includes employee tuition remissions 2018 Bethel Study 20th Annual Financial Aid Survey of CCCU Institutions 12.21.2018
Traditional Undergraduate Programs 2017-18 Discount Rates (All Students) (see pp. 117-122) 62 schools reported Unfunded discount rates from 14.5% to 59.5% (next lowest was 26.6%) 1st Quartile: 39.9% (38.5 last year) 2nd Quartile (median): 43.3% (41.9% last year) 3rd Quartile: 47.4% (46.7% last year) The NACUBO discount rate for the same schools ranged from 29.5% to 61.0% 1st Quartile: 43.2% (41.3% last year) 2nd Quartile (median): 46.1% (43.8% last year) 3rd Quartile: 50.2% (50.6% last year) 2018 Bethel Study 20th Annual Financial Aid Survey of CCCU Institutions 12.21.2018
Traditional Undergraduate Programs Unfunded Discount Rates in CCCU Schools Traditional Undergraduate Programs (2018-19 data is estimated) 80.0% 70.0% 60.0% 60.5% 49.3% 49.5% 50.0% 45.7% 40.0% 41.0% 29.8% 30.0% 26.5% 25.8% 20.0% 20.6% 10.0% 7.0% 0.0% 2000-012001-022002-032003-042004-052005-062006-072007-082008-092009-102010-112011-122012-132013-142014-152015-162016-172017-182018-19 Minimum First Quartile Median (2nd Quartile) Third Quartile Maximum (4th Quartile) 2018 Bethel Study 20th Annual Financial Aid Survey of CCCU Institutions 12.21.2018
Traditional Undergraduate Programs NACUBO Discount Rates in CCCU Schools Traditional Undergraduate Programs (2018-19 data is estimated) 80.0% 70.0% 62.1% 60.0% 52.5% 50.0% 49.3% 48.3% 43.9% 40.0% 35.5% 29.3% 30.0% 26.8% 26.5% 20.0% 10.0% 9.3% 0.0% 2000-012001-022002-032003-042004-052005-062006-072007-082008-092009-102010-112011-122012-132013-142014-152015-162016-172017-182018-19 estimated Minimum First Quartile Median (2nd Quartile) Third Quartile Maximum (4th Quartile) 2018 Bethel Study 20th Annual Financial Aid Survey of CCCU Institutions 12.21.2018
NACUBO Discount Rate: NACUBO & CCCU Surveys Average per Student in Traditional Undergraduate Programs 50% 47.3% 46.3% 45% 40% Discount Rate 35% 33.6% 29.9% 30% NACUBO Study: All CCCU Survey: All CCCU Survey Median: All 25% 20% Academic Year: * Estimated data for 2018-2019 2018 Bethel Study 20th Annual Financial Aid Survey of CCCU Institutions 12.21.2018 22
55% NACUBO Discount Rate 52.2% Average per Student in Traditional Undergraduate Programs 50% 46.3% 45% 40% Discount Rate 37.3% 33.6% 35% 30% NACUBO Study: 1st/Full-time Freshmen NACUBO Study: All 25% 20% Academic Year: * Estimated data for 2018-2019 2018 Bethel Study 20th Annual Financial Aid Survey of CCCU Institutions 12.21.2018 23
Traditional Undergraduate Programs Target Unfunded Discount Rate for 2018- 19 New Students (see p. 131) New Student Target Rate 20.0% 45.0% 50.0% 56.0% 62.4% All Student Estimated Rate 26.5% 40.8% 45.6% 49.4% 60.5% Range of Differences -8.9 points +0.4 points +3.7 points +9.0 points +21.5 points Minimum First Quartile Median Third Quartile Maximum The Range of Differences column illustrates the range of the gap between the new student target discount rate at 55 responding schools and the estimated 18-19 unfunded discount rate for all students at the same schools. A negative range of differences means that the target new student rate at a school is less than their estimated overall discount rate, and vise versa. 2018 Bethel Study 20th Annual Financial Aid Survey of CCCU Institutions 12.21.2018 24
Traditional Undergraduate Programs 2017-18 Needy/Not Needy (see p. 145) 69.7%* percent of students at 57 responding schools were needy (range: 45.6% to 98.0%). Total gift aid to needy students = $1.25 billion Average total gift aid per needy student = $18,217 ($16,909 last year) * weighted average 2018 Bethel Study 20th Annual Financial Aid Survey of CCCU Institutions 12.21.2018
Traditional Undergraduate Programs Percent of Students who are Needy In Traditional Undergraduate Programs 85% 83% 82% 80% 81% 81% 81% 81% 80% 80% 80% 77% 77% 77% 76% 75% 76% 76% 76% 75% 75% 74% 74% 74% 73% 73% 73% 73% 73% 73% 70% 71% 70% 70% 68% 68% 68% 68% 68% 67% 67% 67% 67% 67% 67% 65% 66% 65% 65% 65% 64% 62% 60% 61% 61% 60% 60% 59% 59% 59% 55% 50% 2000-01 2001-02 2002-03 2003-04 2004-05 2005-06 2006-07 2007-08 2008-09 2009-10 2010-11 2011-12 2012-13 2013-14 2014-15 2015-16 2016-17 2017-18 First Quartile Second Quartile (median) Third Quartile 2018 Bethel Study 20th Annual Financial Aid Survey of CCCU Institutions 12.21.2018
Traditional Undergraduate Programs How Needy are our Students? (see p. 149) The average needy student in 2017- 18 at responding schools had demonstrated need of $30,475 (range: $15,619 to $52,581) On average, responding schools meet 59.7% of need with gift aid Minimum: 40.2% 1st Quartile: 55.0% 2nd Quartile (median): 59.5% 3rd Quartile: 65.6% Maximum: 82.8% 2018 Bethel Study 20th Annual Financial Aid Survey of CCCU Institutions 12.21.2018
Traditional Undergraduate Programs Average Need per Needy Student In Traditional Undergraduate Programs $35,000 $30,000 $25,000 $20,000 $15,000 $10,000 First Quartile Second Quartile (median) Third Quartile 2018 Bethel Study 20th Annual Financial Aid Survey of CCCU Institutions 12.21.2018
Traditional Undergraduate Programs 2017-18 Non-Need Students (see p. 171ff.) Percentage of non-need students receiving gift aid 19 of 56 (34%) schools gave non-need gift aid to over 97% of their non- need students Minimum = 18.9% 1st quartile = 80.9% Median = 93.8% 3rd quartile = 98.3% Max = 100% (11 schools) Average total gift aid per non-need aid recipient Minimum = $3,521 1st quartile = $11,141 Median = $13,419 3rd quartile = $15,984 11 schools over $17,000 Max = $29,455 Weighted average total gift aid per needy recipient $18,386 2018 Bethel Study 20th Annual Financial Aid Survey of CCCU Institutions 12.21.2018
Traditional Undergraduate Programs Price compared with Family Wealth (see p. 158ff.) The "wealth index" is an approximate measurement of expected parent contribution from non-independent student families (whether or not they show need). A positive variance means that, compared to other reporting schools, families are wealthier than the norm. 2018 Bethel Study 20th Annual Financial Aid Survey of CCCU Institutions 12.21.2018
Traditional Undergraduate Programs Price Compared with Family Wealth: 2017-18 2018 Bethel Study 20th Annual Financial Aid Survey of CCCU Institutions 12.21.2018
Traditional Undergraduate Programs Family Ability to Pay (Wealth Index) for Traditional Undergraduate Programs $24,000 Average Expected Contribution for Parents of Dependent Students $22,000 $22,025 $20,000 $18,348 $18,000 $17,456 $16,626 $16,000 $15,085 $14,880 $14,000 $13,390 $14,044 $11,802 $12,663 $12,000 $11,766 $10,000 $10,207 $8,000 2003-04 2004-05 2005-06 2006-07 2007-08 2008-09 2009-10 2010-11 2011-12 2012-13 2013-14 2014-15 2015-16 2016-17 2017-18 First Quartile Second Quartile (median) Third Quartile 2018 Bethel Study 20th Annual Financial Aid Survey of CCCU Institutions 12.21.2018
Traditional Undergraduate Programs YOY Change in Total Net Tuition Revenue 20.0% 15.0% 10.0% 5.0% 5.1% 0.2% 0.0% -3.9% -5.0% -10.0% First Quartile Second Quartile (median) Third Quartile 2018 Bethel Study 20th Annual Financial Aid Survey of CCCU Institutions 12.21.2018
Affordability Indicators for Traditional Undergraduate Programs: Student s Perspective Cost of Attendance Budgets Financial Aid Student Debt Net Price / Family Ability to Pay 2018 Bethel Study 20th Annual Financial Aid Survey of CCCU Institutions 12.21.2018
Traditional Undergraduate Programs 2018-19 On-campus Budgets (COA for students in Traditional Undergrad Programs) (see p. 20ff.) Average on-campus student budget is $43,864 Lincoln Christian $26,581 Pepperdine $73,002 This is an increase of 5.6% from 2017-18 (compared with a 3.3% increase from 2016-17 to 2017-18). Up 4.4% without Pepperdine. 2018 Bethel Study 20th Annual Financial Aid Survey of CCCU Institutions 12.21.2018
Traditional Undergraduate Programs Tuition and Fees $60,000 $53,932 $50,000 $40,000 $32,488 $28,590 $30,000 $24,890 $25,270 $20,000 $16,500 $14,350 $12,960 $11,770 $10,000 $5,850 $- 2003-04 2004-05 2005-06 2006-07 2007-08 2008-09 2009-10 2010-11 2011-12 2012-13 2013-14 2014-15 2015-16 2016-17 2017-18 2018-19 Minimum First Quartile Second Quartile (median) Third Quartile Fourth Quartile (maximum) 2018 Bethel Study 20th Annual Financial Aid Survey of CCCU Institutions 12.21.2018
Traditional Undergraduate Programs YOY Change in Tuition/Fees (Sticker Price) for Traditional Undergraduate Programs 9.0% 8.0% 7.3% 7.0% 6.0% 6.0% 5.0% 4.8% 4.5% 4.0% 3.4% 3.0% 2.5% 2.0% 1.0% 0.0% First Quartile Second Quartile (median) Third Quartile 2018 Bethel Study 20th Annual Financial Aid Survey of CCCU Institutions 12.21.2018
Traditional Undergraduate Programs Average Unfunded Institutional Gift Aid (per enrolled student) in Traditional Undergraduate Programs $20,000 $19,016 $18,000 $16,000 $13,390 $14,000 $12,000 $11,174 $10,000 $9,984 $8,000 $6,448 $6,000 $4,155 $4,000 $3,239 $2,706 $2,545 $2,000 $750 $- 2000-01 2001-02 2002-03 2003-04 2004-05 2005-06 2006-07 2007-08 2008-09 2009-10 2010-11 2011-12 2012-13 2013-14 2014-15 2015-16 2016-17 2017-18 Minimum First Quartile Second Quartile (median) Third Quartile Fourth Quartile (maximum) 2018 Bethel Study 20th Annual Financial Aid Survey of CCCU Institutions 12.21.2018
Traditional Undergraduate Programs Average Federal Gift Aid (per enrolled student) in Traditional Undergraduate Programs $2,500 $2,000 $1,993 $1,906 $1,599 $1,500 $1,328 $1,000 $921 $693 $500 $- 2000-01 2001-02 2002-03 2003-04 2004-05 2005-06 2006-07 2007-08 2008-09 2009-10 2010-11 2011-12 2012-13 2013-14 2014-15 2015-16 2016-17 2017-18 Minimum First Quartile Second Quartile (median) Third Quartile 2018 Bethel Study 20th Annual Financial Aid Survey of CCCU Institutions 12.21.2018
Traditional Undergraduate Programs Average State Gift (per enrolled student) in Traditional Undergraduate Programs $2,500 $2,000 $1,797 $1,500 $1,321 $1,122 $1,000 $835 $566 $500 $353 $49 $32 $- 2000-01 2001-02 2002-03 2003-04 2004-05 2005-06 2006-07 2007-08 2008-09 2009-10 2010-11 2011-12 2012-13 2013-14 2014-15 2015-16 2016-17 2017-18 Minimum First Quartile Second Quartile (median) Third Quartile 2018 Bethel Study 20th Annual Financial Aid Survey of CCCU Institutions 12.21.2018
Traditional Undergraduate Programs 2017-18 Borrowing: Average per Enrolled Student (see p. 61-62) Perkins $177 Subsidized $2,177 Unsubsidized $2,042 Other $1,261 PLUS $1,846 Total $7,503 2% Perkins Subsidized Unsubsidized Other PLUS 26% 28% 18% 26% 2018 Bethel Study 20th Annual Financial Aid Survey of CCCU Institutions 12.21.2018
Traditional Undergraduate Programs Average Loan (per enrolled student) Traditional Undergraduates $10,000 $8,737 $8,537 $8,499 $8,666 $9,000 $8,553 $8,389 $8,005 $8,131 $8,241 $8,222 $7,769 $7,741 $8,000 $7,333 $7,294 $7,404 $7,486 $7,467 $6,816 $6,958 $7,084 $7,225 $7,259 $7,180 $6,990 $7,020 $6,658 $7,000 $6,385 $6,376 $5,797 $6,000 $5,607 $6,375 $5,468 $5,825 $5,929 $5,940 $6,106 $6,263 $6,158 $5,177 $5,829 $5,834 $5,770 $4,812 $5,579 $5,000 $4,559 $5,226 $4,257 $5,056 $3,963 $4,527 $4,000 $4,098 $3,734 $3,000 $2,923 $3,100 $2,000 $1,000 $- 2000-01 2001-02 2002-03 2003-04 2004-05 2005-06 2006-07 2007-08 2008-09 2009-10 2010-11 2011-12 2012-13 2013-14 2014-15 2015-16 2016-17 2017-18 First Quartile Second Quartile (median) Third Quartile 2018 Bethel Study 20th Annual Financial Aid Survey of CCCU Institutions 12.21.2018
Traditional Undergraduate Programs % Graduates Borrowing Educational Loans in Traditional Undergraduate Programs 100 95 88 90 79 80 79 79 71 74 Percent of Graduates who Borrowed 72 70 66 63 60 50 41 40 30 20 10 0 2001-02 2002-03 2003-04 2004-05 2005-06 2006-07 2007-08 2008-09 2009-10 2010-11 2011-12 2012-13 2013-14 2014-15 2015-16 2016-17 2017-18 Minimum First Quartile Second Quartile (median) Third Quartile Fourth Quartile (maximum) 2018 Bethel Study 20th Annual Financial Aid Survey of CCCU Institutions 12.21.2018
Traditional Undergraduate Programs Average Educational Debt of Graduates from Traditional Undergraduate Programs (excludes minimum and maximum) $35,000 $33,077 $29,457 $30,000 $26,570 $25,000 $20,000 $18,132 $16,577 $15,000 $14,690 $10,000 First Quartile Second Quartile (Median) Third Quartile 2018 Bethel Study 20th Annual Financial Aid Survey of CCCU Institutions 12.21.2018
Traditional Undergraduate Programs Average Student Loan Debt (see p. 93ff.) On average 72% of FY18 graduates at 60 responding schools borrowed student loans (range: 44% to 100%). Their average debt was $29,570 (range: $14,194 to $39,930). 30 of 60 (50%) of responding schools had average debts ranging from $26,660 to $33,088 The average debt, at schools where students borrowed, equaled 102% of 2017-2018 tuition and fees at each student s school (range: 40% to 212%). 2018 Bethel Study 20th Annual Financial Aid Survey of CCCU Institutions 12.21.2018
3-Year Cohort Default Rates Most recent three-year default rate on government loans (FY2015 official). 16 14 National Average Default Rate All Schools (10.8%) 12 10 National Average Default Rate Private 4-Year (6.6%) 8 6 4 2 0 Lee Univ., TN CO Chr. Univ., CO Houghton Coll., NY Bethel Univ., MN Gordon Coll., MA Taylor Univ., IN Tabor Coll., KS Geneva Coll., PA Crown Coll., MN Nyack Coll., NY Messiah Coll., PA John Brown Univ., AR Northwest Nazarene Univ., ID Northwestern Coll., IA Trinity Chr. Coll., IL OK Chr. Univ., OK Spring Arbor Univ., MI Emmanuel Coll., GA Ouachita Baptist Univ., AR Campbellsville Univ., KY Walla Walla Univ., WA Harding Univ., AR OK Baptist Univ., OK KY Chr. Univ., KY George Fox Univ., OR Calvin Coll., MI Milligan Coll., TN Huntington Univ., IN Providence Chr. Coll., CA Dordt Coll., IA Lipscomb Univ., TN Lincoln Chr. Univ., IL MidAmerica Nazarene Univ., KS Asbury Univ., KY Warner Pacific Coll., OR Wheaton Coll., IL Greenville Coll., IL William Jessup Univ., CA LeTourneau Univ., TX Cornerstone Univ., MI Corban Univ., OR Olivet Nazarene Univ., IL Evangel Univ., MO S. Wesleyan Univ., SC Westmont Coll., CA Univ. of Northwestern - St Paul, MN Northwest Univ., WA Bluefield Coll., VA Pepperdine Univ., CA Biola Univ., CA Grace Coll., IN Sterling Coll., KS Point Loma Nazarene Univ., CA Anderson Univ., SC Roberts Wesleyan Coll., NY Fresno Pacific Univ., CA Trevecca Nazarene Univ., TN Seattle Pacific Univ., WA Vanguard Univ. of S. CA, CA IN Wesleyan Univ., IN Palm Beach Atlantic Univ., FL Hope Internat. Univ., CA SOURCE: U.S. Department of Education Default Management, Official Cohort Default Rates for Schools, retrieved 12.20.2018 https://www2.ed.gov/offices/OSFAP/defaultmanagement/cdr.html 2018 Bethel Study 20th Annual Financial Aid Survey of CCCU Institutions 12.21.2018 46
Traditional Undergraduate Programs CCCU Median Net Price Per Student and Wealth Index $25,000 $21,174 $20,000 $17,456 $17,044 $15,000 $15,195 $10,000 $5,000 $- 2008-09 2009-10 2010-11 2011-12 2012-13 2013-14 2014-15 2015-16 2016-17 2017-18 Median Net Price Median Wealth Index 2018 Bethel Study 20th Annual Financial Aid Survey of CCCU Institutions 12.21.2018
Traditional Undergraduate Programs CCCU Median Net Price Per Student, Wealth Index and TFRB $40,000 $37,390 $35,000 $30,000 $27,000 $25,000 $21,174 $20,000 $17,456 $17,044 $15,195 $15,000 $10,000 $5,000 $- 2008-09 2009-10 2010-11 2011-12 2012-13 2013-14 2014-15 2015-16 2016-17 2017-18 Median Net Price Median Wealth Index CCCU Median TFRB 2018 Bethel Study 20th Annual Financial Aid Survey of CCCU Institutions 12.21.2018
Implications for our Schools (discussion) 2018 Bethel Study 20th Annual Financial Aid Survey of CCCU Institutions 12.21.2018
Questions? Contact Dan Nelson or Jeff Olson if you have specific questions dc-nelson@bethel.edu jeff-olson@bethel.edu Email the CCCU financial aid administrators e-list to foster a broader conversation 2018 Bethel Study 20th Annual Financial Aid Survey of CCCU Institutions 12.21.2018


")


")

")


![[Insert Study Name] Study Webinar: Engaging Participants for Research Progress](/thumb/168084/insert-study-name-study-webinar-engaging-participants-for-research-progress.jpg)