Bias, Variance, and the Bias-Variance Tradeoff in Machine Learning and Pattern Recognition
Explore the concepts of bias, variance, and the tradeoff between them in the context of machine learning and pattern recognition. Learn about the No Free Lunch Theorem, bias-variance tradeoff, and measures of generalization. Discover how bias and variance impact the accuracy and precision of learning algorithms and their alignment with classification problems.

Download Presentation

Please find below an Image/Link to download the presentation.
The content on the website is provided AS IS for your information and personal use only. It may not be sold, licensed, or shared on other websites without obtaining consent from the author. If you encounter any issues during the download, it is possible that the publisher has removed the file from their server.
You are allowed to download the files provided on this website for personal or commercial use, subject to the condition that they are used lawfully. All files are the property of their respective owners.
The content on the website is provided AS IS for your information and personal use only. It may not be sold, licensed, or shared on other websites without obtaining consent from the author.
E N D
Presentation Transcript
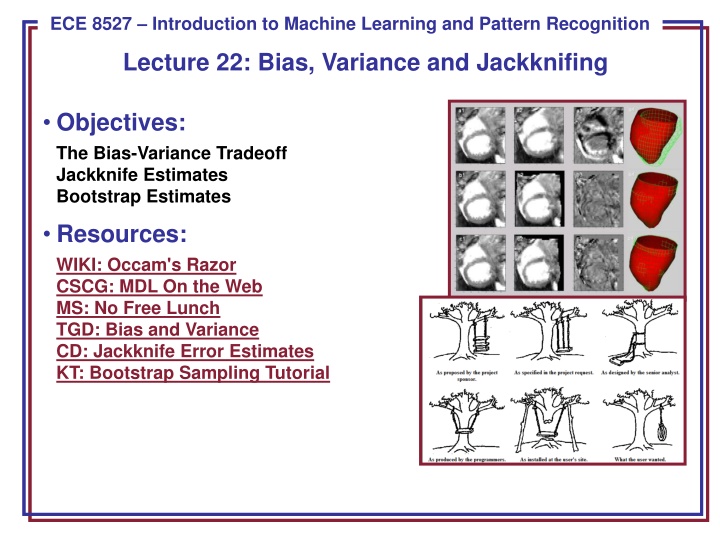
ECE 8443 Pattern Recognition ECE 8527 Introduction to Machine Learning and Pattern Recognition Lecture 22: Bias, Variance and Jackknifing Objectives: The Bias-Variance Tradeoff Jackknife Estimates Bootstrap Estimates Resources: WIKI: Occam's Razor CSCG: MDL On the Web MS: No Free Lunch TGD: Bias and Variance CD: Jackknife Error Estimates KT: Bootstrap Sampling Tutorial
No Free Lunch Theorem A natural measure of generalization is the expected value of the error given D: ? ? ? = ? ? 1 ? ? ? , (?) ?( ?)?(? ?) ,? ? ? where ?() denotes the Kronecker delta function (value of 1 if the two arguments match, a value of zero otherwise). The expected off-training set classification error when the true function ?(?) and the probability for the ?? candidate learning algorithm is ??( (?) ?) is: ??? ?,? = ? ?? ? 1 ? ? ? , (?)??( (?) ?) No Free Lunch Theorem: For any two learning algorithms ?1( ?) and ?2( ?), the following are true independent of the sampling distribution?(?)and the number of training points: 1. Uniformly averaged over all target functions, ?, ?1(? ?,?) ?2(? ?,?) = 0. 2. For any fixed training set ?, uniformly averaged over ?, ?1(? ?,?) ?2(? ?,?) = 0. 3. Uniformly averaged over all priors ?(?),?1(? ?,?) ?2(? ?,?) = 0. 4. For any fixed training set ?, uniformly averaged over ?(?), ?1(? ?,?) ?2(? ?,?) = 0. ECE 8527: Lecture 22, Slide 1
Bias and Variance Two ways to measure the match of alignment of the learning algorithm to the classification problem involve the bias and variance. Bias measures the accuracy in terms of the distance from the true value of a parameter high bias implies a poor match. Variance measures the precision of a match in terms of the squared distance from the true value high variance implies a weak match. For mean-square error, bias and variance are related. Consider these in the context of modeling data using regression analysis. Suppose there is an unknown function ?(?) which we seek to estimate based on ? samples in a set ? drawn from ?(?). The regression function will be denoted ?(?;?). The mean square error of this estimate is: ?? ? ?;? ?(?)2= ??? ?;? ?(?) The first term is the bias and the second term is the variance. ?+ ?? ? ?;? ??? ?;? ? This is known as the bias-variance tradeoff since more flexible classifiers tend to have lower bias but higher variance. ECE 8527: Lecture 22, Slide 2
Bias and Variance for a Two-Class Problem Consider our two-category classification problem: ? = 1 ? = 1 ?? ? ? = ?? ? = 0 ? Consider a discriminant function: ? = ? ? + ? where ? is a zero-mean random variable with a binomial distribution with variance: ??? ? ? = ? ? ? ? ? The target function can be expressed as ? ? = ? ? ? . Our goal is to minimize ?? ? ?;? ??. Assuming equal priors, the classification error rate can be shown to be: ?? ? ?;? ? = 2? ? 1?? ? ?;? ?? +?? ?? ? where ?? is the Bayes discriminant (1/2 in the case of equal priors). The key point here is that the classification error is linearly proportional to ?? ? ?;? ??, which can be considered a boundary error in that it represents the incorrect estimation of the optimal (Bayes) boundary. ECE 8527: Lecture 22, Slide 3
Nonlinear Relationship Between Bias and Variance If we assume ?(?(?;?)) is a Gaussian distribution, we can compute this error by integrating the tails of the distribution, and can show: 1/2 ?? ? ?;? ? = ??? ? ? 1/2 ?? ? ?;? 1/2 ??? ? ?;? The key point here is that the first term in the argument is the boundary bias and the second term is the variance. Hence, we see that the bias and variance are related in a nonlinear manner. For classification the relationship is multiplicative. Typically, variance dominates bias and hence classifiers are designed to minimize variance. ECE 8527: Lecture 22, Slide 4
The Bias-Variance Dilemma for Regression The bias-variance dilemma can be illustrated using regression. Each column represents a different model, each row a different training. Column a) shows a very poor model: a linear g(x) whose parameters are held fixed, independent of the training data. This model has high bias and zero variance. Column b) shows a somewhat better model, though it too is held fixed, independent of the training data. It has a lower bias than in a) and the same zero variance. Column c) shows a cubic model. Column d) shows a linear model that is adjusted to fit each training set; this model has intermediate bias and variance. ECE 8527: Lecture 22, Slide 5
The Bias-Variance Dilemma for a 2D Gaussian The (boundary) bias-variance tradeoff in classification can be illustrated with a two-dimensional Gaussian problem. The figure at the top shows the (true) decision boundary of the Bayes classifier. The nine figures in the middle show nine different learned decision boundaries. Each row corresponds to a different training set of n = 8 points selected randomly from the true distributions and labeled according to the true decision boundary. Column a) shows the decision boundaries learning by fitting a Gaussian model with fully general covariance matrices by maximum likelihood. The learned boundaries differ significantly from one data set to the next; this learning algorithm has high variance. Column b) shows the decision boundaries resulting from fitting a Gaussian model with diagonal covariances; in this case the decision boundaries vary less from one row to another. This learning algorithm has a lower variance than the one at the left. Column c) at the right shows decision boundaries learning by fitting a Gaussian model with unit covariances (i.e., a linear model); notice that the decision boundaries are nearly identical from one data set to the next. This algorithm has low variance. ECE 8527: Lecture 22, Slide 6
Resampling For Estimating Statistics How can we estimate the bias and variance from real data? Suppose we have a set ? of ? data points, ?? for ? = 1, ,?. The estimates of the mean/sample variance are: 1 ? ?=1 ??and ??=? 1 ? ?(?? ?)2 ? ?=1 ? = Suppose we wanted to estimate other statistics, such as the median or mode. There is no straightforward way to measure the error. The jackknife and bootstrap techniques are two of the most popular resampling techniques to estimate such statistics. 1 ??=?? ?? ? Use the leave-one-out method: ?(?)= This is just the sample average if the ?? point is deleted. ? 1. ? 1 ? ? 1 ? ?=1 ? The jackknife estimate of the mean is defined as:?( )= ?(?). 2. The variance of this estimate is: ??? ? =? 1 ? ? ?=1 ?(?) ?( ) The benefit of this expression is that it can be applied to any statistic. ECE 8527: Lecture 22, Slide 7
Jackknife Bias and Variance Estimates We can write a general estimate for the bias as: ???? = ? ? ? . The jackknife method can be used to estimate this bias. The procedure is to delete points ?? one at a time from ? and then compute: ?( )= 1 ? ?=1 ?(?). ? ?( ) ? . The bias in the jackknife estimate is: ????????= ? 1 We can rearrange terms: ? = ? ????????= ? ? ? 1 ?(?) This is an unbiased estimate of the bias. Why? 2 Recall the traditional variance: ??? ? = ? ? ? ? The jackknife estimate of the variance is: ? ??????? ? =? 1 2 ?(?) ? ? ?=1 This same strategy can be applied to estimation of other statistics. ECE 8527: Lecture 22, Slide 8
Bootstrap A bootstrap data set is one created by randomly selecting ? points from the training set ?, with replacement. In bootstrap estimation, this selection process is repeated ? times to yield ? bootstrap data sets, which are treated as independent sets. The bootstrap estimate of a statistic, ?, is denoted ? ( ), and is merely the mean of the ? estimates on the individual bootstrap data sets: ? ( )=1 ? ? 1 ? ? (?) 1 ? ? 1 ? (?) ? = ? ( ) ? ? The bootstrap estimate of the bias is: ????????= ? (?) ? ( )2 1 ? ? 1 ? The bootstrap estimate of the variance is:???????= The bootstrap estimate of the variance of the mean can be shown to approach the traditional variance of the mean as ? . The larger the number of bootstrap samples, the better the estimate. ECE 8527: Lecture 22, Slide 9
Summary The No Free Lunch Theorem essentially says all algorithms averaged over all possible data sets perform similarly. Most parameter estimation algorithms trade-off between bias (asymptotic error) and variance (fluctuation in the estimate). Variance tends to dominate so we seek estimation algorithms that reduce variance. Resampling techniques tend to use data in a different manner to recude variance: Jackknifing: constructing estimates on held-out data from training data in which a small number of elements are removed. Bootstrapping: partitioning the data into subsets and averaging models built on these subsets. ECE 8527: Lecture 22, Slide 10