Big Data Marketing Research at Tamkang University - Measurement & Scaling Course Details
Explore the syllabus, topics, and activities of the Big Data Marketing Research course at Tamkang University, focusing on measurement, scaling, and advanced marketing analytics. Dive into the latest research papers and discussions on big data, social innovation, and market sentiment analysis.
Uploaded on | 1 Views
Download Presentation

Please find below an Image/Link to download the presentation.
The content on the website is provided AS IS for your information and personal use only. It may not be sold, licensed, or shared on other websites without obtaining consent from the author. If you encounter any issues during the download, it is possible that the publisher has removed the file from their server.
You are allowed to download the files provided on this website for personal or commercial use, subject to the condition that they are used lawfully. All files are the property of their respective owners.
The content on the website is provided AS IS for your information and personal use only. It may not be sold, licensed, or shared on other websites without obtaining consent from the author.
E N D
Presentation Transcript
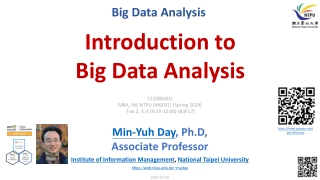
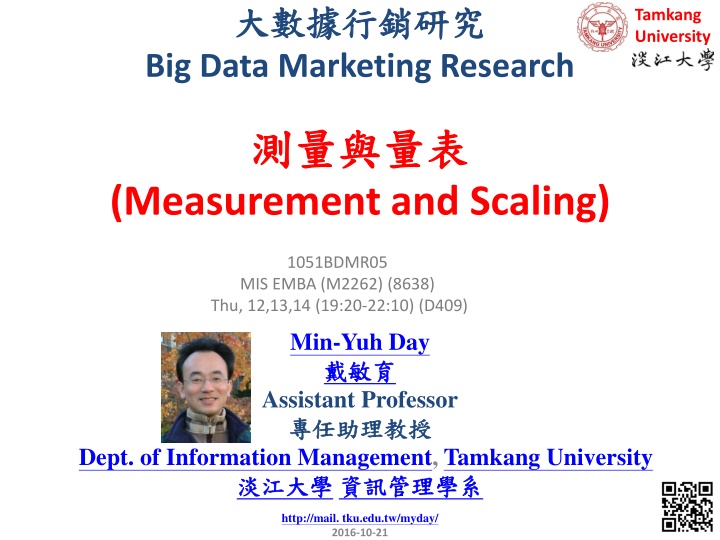
Big Data Marketing Research Tamkang University (Measurement and Scaling) 1051BDMR05 MIS EMBA (M2262) (8638) Thu, 12,13,14 (19:20-22:10) (D409) Min-Yuh Day Assistant Professor Dept. of Information Management, Tamkang University http://mail. tku.edu.tw/myday/ 2016-10-21 1
(Syllabus) (Week) (Date) (Subject/Topics) 1 2016/09/16 ( ) (Mid-Autumn Festival Holiday)(Day off) 2 2016/09/23 (Course Orientation for Big Data Marketing Research) 3 2016/09/30 (Data Science and Big Data Marketing) 4 2016/10/07 (Big Data Marketing Analytics and Research) 5 2016/10/14 (Measuring the Construct) 6 2016/10/21 (Measurement and Scaling) 2
(Syllabus) (Week) (Date) (Subject/Topics) 7 2016/10/28 I (Case Study on Big Data Marketing I) 8 2016/11/04 (Exploratory Factor Analysis) 9 2016/11/11 (Confirmatory Factor Analysis) 10 2016/11/18 (Midterm Presentation) 11 2016/11/25 (Social Computing and Big Data Analytics) 12 2016/12/02 (Social Network Analysis) 3
(Syllabus) (Week) (Date) (Subject/Topics) 13 2016/12/09 II (Case Study on Big Data Marketing II) 14 2016/12/16 (Measurements and Practices of Social Network Analysis) 15 2016/12/23 (Big Data Sentiment Analysis) 16 2016/12/30 (FinTech Marketing Research) 17 2017/01/06 I (Term Project Presentation I) 18 2017/01/13 II (Term Project Presentation II) 4
Outline A paradigm for developing better measures of marketing constructs Current practice in scale development The linkage among attitudes, behavior, and marketing effectiveness Measurement Scales 5
Big Data Marketing Research Papers 1. Ashman, R., & Patterson, A. (2015). Seeing the big picture in services marketing research: infographics, SEM and data visualisation. Journal of Services Marketing, 29(6-7), 613-621. 2. Calder, B. J., Malthouse, E. C., & Maslowska, E. (2016). Brand marketing, big data and social innovation as future research directions for engagement. Journal of Marketing Management, 32(5-6), 579-585. 3. Chintagunta, P., Hanssens, D. M., & Hauser, J. R. (2016). Marketing Science and Big Data. Marketing Science, 35(3), 341-342. 4. Dhar, V. (2014). Big Data and the Rise of Machines in Financial Markets. Big Data, 2(2), 65-67. 5. Dhar, V. (2014). Can Big Data Machines Analyze Stock Market Sentiment? Big Data, 2(4), 177-181. 6
Big Data Marketing Research Papers 6. Donnelly, C., Simmons, G., Armstrong, G., & Fearne, A. (2015). Digital loyalty card "big data' and small business marketing: Formal versus informal or complementary? International Small Business Journal, 33(4), 422-442. 7. Erevelles, S., Fukawa, N., & Swayne, L. (2016). Big Data consumer analytics and the transformation of marketing. Journal of Business Research, 69(2), 897-904. 8. Fan, S. K., Lau, R. Y. K., & Zhao, J. L. (2015). Demystifying Big Data Analytics for Business Intelligence Through the Lens of Marketing Mix. Big Data Research, 2(1), 28-32. 9. Gutmann, J. (2015). Humanizing Big Data: Marketing at the Meeting of Social Science and Consumer Insight. International Journal of Market Research, 57(3), 503-505. 10.Jun, S., Park, S., & Jang, D. (2015). A Technology Valuation Model Using Quantitative Patent Analysis: A Case Study of Technology Transfer in Big Data Marketing. Emerging Markets Finance and Trade, 51(5), 963-974. 7
Big Data Marketing Research Papers 11. Mouncey, P. (2016). Creating value with Big Data analytics: making smarter marketing decisions. International Journal of Market Research, 58(5), 761- 764. 12. Perera, C., Ranjan, R., & Wang, L. Z. (2015). End-to-End Privacy for Open Big Data Markets. IEEE Cloud Computing, 2(4), 44-53. 13. Schepp, N. P., & Wambach, A. (2016). On Big Data and Its Relevance for Market Power Assessment. Journal of European Competition Law & Practice, 7(2), 120-124. 14. Tirunillai, S., & Tellis, G. J. (2014). Mining Marketing Meaning from Online Chatter: Strategic Brand Analysis of Big Data Using Latent Dirichlet Allocation. Journal of Marketing Research, 51(4), 463-479. 15. Xu, Z. N., Frankwick, G. L., & Ramirez, E. (2016). Effects of big data analytics and traditional marketing analytics on new product success: A knowledge fusion perspective. Journal of Business Research, 69(5), 1562-1566. 8
Big Data Marketing Research Papers 16. Lau, R. Y., Zhao, J. L., Chen, G., & Guo, X. (2016). Big data commerce. Information & Management. 17. Aloysius, J. A., Hoehle, H., Goodarzi, S., & Venkatesh, V. (2016). Big data initiatives in retail environments: Linking service process perceptions to shopping outcomes. Annals of Operations Research, 1-27. 18. Li, J., Tao, F., Cheng, Y., & Zhao, L. (2015). Big Data in product lifecycle management. The International Journal of Advanced Manufacturing Technology, 81(1-4), 667-684. 19. Chong, A. Y. L., Li, B., Ngai, E. W., Ch'ng, E., & Lee, F. (2016). Predicting online product sales via online reviews, sentiments, and promotion strategies: A big data architecture and neural network approach. International Journal of Operations & Production Management, 36(4), 358-383. 20. Hartmann, P. M., Hartmann, P. M., Zaki, M., Zaki, M., Feldmann, N., Feldmann, N., ... & Neely, A. (2016). Capturing value from big data a taxonomy of data- driven business models used by start-up firms. International Journal of Operations & Production Management, 36(10), 1382-1406. 9
Chintagunta, P., Hanssens, D. M., & Hauser, J. R. (2016). Marketing Science and Big Data. Marketing Science, 35(3), 341-342. 10
Culotta, A., & Cutler, J. (2016). Mining brand perceptions from Twitter social networks. Marketing Science, 35(3), 343-362. 11
Ringel, D. M., & Skiera, B. (2016). Visualizing asymmetric competition among more than 1,000 products using big search data. Marketing Science,35(3), 511-534. 12
Lau, R. Y., Zhao, J. L., Chen, G., & Guo, X. (2016). Big data commerce. Information & Management. 13
Big Data Commerce Source: Lau, R. Y., Zhao, J. L., Chen, G., & Guo, X. (2016). Big data commerce. Information & Management. 14
Customer Perceived Value, Customer Satisfaction, and Loyalty Customer Perceived Performance Customer Perceived Value Customer Satisfaction Customer Loyalty Customer Expectations 15 Source: Philip Kotler & Kevin Lane Keller, Marketing Management, 14th ed., Pearson, 2012
Measuring Loyalty 5 Variables (Items) (5:1) (Zeithaml, Berry & Parasuraman, 1996) Say positive things about XYZ to other people. Recommend XYZ to someone who seeks your advice. Loyalty Encourage friends and relatives to do business with XYZ. Consider XYZ your first choice to buy services. Do more business with XYZ in the next few years. Source: Valarie A. Zeithaml, Leonard L. Berry and A. Parasuraman, The Behavioral Consequences of Service Quality, Journal of Marketing, Vol. 60, No. 2 (Apr., 1996), pp. 31-46 16
A paradigm for developing better measures of marketing constructs Churchill, G. A., Jr., (1979), A paradigm for developing better measures of marketing constructs. Journal of Marketing Research, 16(February), 64-73. 17
Suggested Procedure for Developing Better Measures (Churchill, 1979)(A Paradigm for Developing Better Measures of marketing Constructs) 18
Suggested Procedure for Developing Better Measures (Churchill, 1979) Recommended Coefficients or Techniques Procedure 1. Specify domain of the construct Literature search 2. Generate sample of Items Literature search Experience survey Insight stimulating examples Critical incidents Focus groups 3. Collect data Coefficient alpha Factor analysis 4. Purify measure 5. Collect data Coefficient alpha Split-half reliability 6. Assess reliability Multitrait-multimethod matrix Criterion validity 7. Assess validity Average and other statistics summarizing distribution of scores 8. Develop norms Source: (Churchill, 1979)(A Paradigm for Developing Better Measures of marketing Constructs) 19
The Problem and Approach Developing measures which have desirable reliability and validity properties The process of measurement of operationalization involves rules for assigning numbers to objects to represent quantities of attributes . Consider some arbitrary construct, C, such as customer satisfaction. X0= XT+ XS+ XR X0= Observed score XR= Random sources of error XT= True score XS= Systematic sources of error 20
Scale Development Example from (Davis, 1989) Perceived Usefulness, Perceived Ease of Use, and User Acceptance of Information Technology Fred D. Davis MIS Quarterly Vol. 13, No. 3 (Sep., 1989), pp. 319-340 21
TAM (1989) Perceived Usefulness Perceived Ease of Use Fred D. Davis (1989), Perceived Usefulness, Perceived Ease of Use, and User Acceptance of Information Technology, MIS Quarterly, Vol. 13, No. 3 (Sep., 1989), pp. 319-340 22
TAM (1989) Perceived Usefulness Perceived Ease of Use (Davis et al., 1989) User acceptance of computer technology : A comparison of two theoretical models Source: Davis,F.D.,R.P.Bagozzi and P.R.Warshaw, User acceptance of computer technology : A comparison of two theoretical models ,Management Science,35(8),August 1989,pp.982-1003 23
Scale Development Example from (Davis, 1989) Scale Development and Pretest A step-by-step process was used to develop new multi-item scales having high reliability and validity. The conceptual definitions of perceived usefulness and perceived ease of use, stated above, were used to generate 14 candidate items for each construct from past literature. Pretest interviews were then conducted to assess the semantic content of the items. Those items that best fit the definitions of the constructs were retained, yielding 10 items for each construct. Next, a field study (Study 1) of 112 users concerning two different interactive computer systems was conducted in order to assess the reliability and construct validity of the resulting scales. The scales were further refined and streamlined to six items per construct. A lab study (Study 2) involving 40 participants and two graphics systems was then conducted. Data from the two studies were then used to assess the relationship between usefulness, ease of use, and self-reported usage. Fred D. Davis (1989), Perceived Usefulness, Perceived Ease of Use, and User Acceptance of Information Technology, MIS Quarterly, Vol. 13, No. 3 (Sep., 1989), pp. 319-340 24
Suggested Procedure for Developing Better Measures (Churchill, 1979) Recommended Coefficients or Techniques Procedure 1. Specify domain of the construct 1. Specify domain of the construct Literature search 2. Generate sample of Items Literature search Experience survey Insight stimulating examples Critical incidents Focus groups 3. Collect data Coefficient alpha Factor analysis 4. Purify measure 5. Collect data Coefficient alpha Split-half reliability 6. Assess reliability Multitrait-multimethod matrix Criterion validity 7. Assess validity Average and other statistics summarizing distribution of scores 8. Develop norms Source: (Churchill, 1979)(A Paradigm for Developing Better Measures of marketing Constructs) 25
1. Specify Domain of the Construct Theoretical Definition Perceived Usefulness: The degree to which a person believes that using a particular system would enhance job performance Perceived Ease of Use: The degree to which a person believes that using a particular system would be free of effort. Fred D. Davis (1989), Perceived Usefulness, Perceived Ease of Use, and User Acceptance of Information Technology, MIS Quarterly, Vol. 13, No. 3 (Sep., 1989), pp. 319-340 26
Suggested Procedure for Developing Better Measures (Churchill, 1979) Recommended Coefficients or Techniques Procedure 1. Specify domain of the construct Literature search 2. Generate sample of Items 2. Generate sample of Items Literature search Experience survey Insight stimulating examples Critical incidents Focus groups 3. Collect data Coefficient alpha Factor analysis 4. Purify measure 5. Collect data Coefficient alpha Split-half reliability 6. Assess reliability Multitrait-multimethod matrix Criterion validity 7. Assess validity Average and other statistics summarizing distribution of scores 8. Develop norms Source: (Churchill, 1979)(A Paradigm for Developing Better Measures of marketing Constructs) 27
2. Generate Sample of Items Literature search Experience survey Insight stimulating examples Critical incidents Focus groups 28
2. Generate Sample of Items (Cont.) Perceived Usefulness Perceived Ease of Use Fred D. Davis (1989), Perceived Usefulness, Perceived Ease of Use, and User Acceptance of Information Technology, MIS Quarterly, Vol. 13, No. 3 (Sep., 1989), pp. 319-340 29
2. Generate Sample of Items (Cont.) Perceived Usefulness Fred D. Davis (1989), Perceived Usefulness, Perceived Ease of Use, and User Acceptance of Information Technology, MIS Quarterly, Vol. 13, No. 3 (Sep., 1989), pp. 319-340 30
2. Generate Sample of Items (Cont.) Perceived Ease of Use Fred D. Davis (1989), Perceived Usefulness, Perceived Ease of Use, and User Acceptance of Information Technology, MIS Quarterly, Vol. 13, No. 3 (Sep., 1989), pp. 319-340 31
Suggested Procedure for Developing Better Measures (Churchill, 1979) Recommended Coefficients or Techniques Procedure 1. Specify domain of the construct Literature search 2. Generate sample of Items Literature search Experience survey Insight stimulating examples Critical incidents Focus groups 3. Collect data 4. Purify measure Coefficient alpha Factor analysis 4. Purify measure 5. Collect data Coefficient alpha Split-half reliability 6. Assess reliability Multitrait-multimethod matrix Criterion validity 7. Assess validity Average and other statistics summarizing distribution of scores 8. Develop norms Source: (Churchill, 1979)(A Paradigm for Developing Better Measures of marketing Constructs) 32
4. Purify the Measure Perceived Usefulness Perceived Ease of Use Fred D. Davis (1989), Perceived Usefulness, Perceived Ease of Use, and User Acceptance of Information Technology, MIS Quarterly, Vol. 13, No. 3 (Sep., 1989), pp. 319-340 33
4. Purify the Measure Perceived Usefulness Fred D. Davis (1989), Perceived Usefulness, Perceived Ease of Use, and User Acceptance of Information Technology, MIS Quarterly, Vol. 13, No. 3 (Sep., 1989), pp. 319-340 34
4. Purify the Measure Perceived Ease of Use Fred D. Davis (1989), Perceived Usefulness, Perceived Ease of Use, and User Acceptance of Information Technology, MIS Quarterly, Vol. 13, No. 3 (Sep., 1989), pp. 319-340 35
Suggested Procedure for Developing Better Measures (Churchill, 1979) Recommended Coefficients or Techniques Procedure 1. Specify domain of the construct Literature search 2. Generate sample of Items Literature search Experience survey Insight stimulating examples Critical incidents Focus groups 3. Collect data Coefficient alpha Factor analysis 4. Purify measure 5. Collect data 6. Assess reliability Coefficient alpha Split-half reliability 6. Assess reliability Multitrait-multimethod matrix Criterion validity 7. Assess validity Average and other statistics summarizing distribution of scores 8. Develop norms Fred D. Davis (1989), Perceived Usefulness, Perceived Ease of Use, and User Acceptance of Information Technology, MIS Quarterly, Vol. 13, No. 3 (Sep., 1989), pp. 319-340 36
6. Assess Reliability with New Data Fred D. Davis (1989), Perceived Usefulness, Perceived Ease of Use, and User Acceptance of Information Technology, MIS Quarterly, Vol. 13, No. 3 (Sep., 1989), pp. 319-340 37
6. Assess Reliability with New Data (cont.) Fred D. Davis (1989), Perceived Usefulness, Perceived Ease of Use, and User Acceptance of Information Technology, MIS Quarterly, Vol. 13, No. 3 (Sep., 1989), pp. 319-340 38
Suggested Procedure for Developing Better Measures (Churchill, 1979) Recommended Coefficients or Techniques Procedure 1. Specify domain of the construct Literature search 2. Generate sample of Items Literature search Experience survey Insight stimulating examples Critical incidents Focus groups 3. Collect data Coefficient alpha Factor analysis 4. Purify measure 5. Collect data Coefficient alpha Split-half reliability 6. Assess reliability 7. Assess validity Multitrait-multimethod matrix Criterion validity 7. Assess validity Average and other statistics summarizing distribution of scores 8. Develop norms Source: (Churchill, 1979)(A Paradigm for Developing Better Measures of marketing Constructs) 39
7. Assess Construct Validity Multitrait-multimethod matrix Criterion validity 40
2. The validity coefficients (3) should be higher than the correlations in the heterotrait- monomethod triangles (2) which suggests that the correlation within a trait measured by different methods must be higher than the correlations between traits which have method in common. 1. Entries in the validity diagonal (3) should be higher than the correlations that occupy the same row and column in the heteromethod block (4). This is a minimum requirement. MTMM 1. r 2. r 3. r 4. r 3. The pattern of correlations should be the same in all of the heterotrait triangles, e.g., both (2) and (4). (Churchill, 1979)(A Paradigm for Developing Better Measures of marketing Constructs) 41
Does the Measure as Expected? (Churchill, 1979) Four separate propositions (Nunnally, 1967, p. 93) 1. The constructs job satisfaction (A) and likelihood of quitting (B) are related. 2. The scale X provides a measure of A. 3. Y provides a measure of B. 4. X and Y correlate positively. Only the fourth proposition is directly examined with empirical data. To establish that X truly measures A, one must assume that propositions 1 and 3 are correct. One must have a good measure for B, and the theory relating A and B must be true. The analyst tries to establish the construct validity of a measure by relating it to a number of other constructs and not simply one. 42
7. Assess Construct Validity Fred D. Davis (1989), Perceived Usefulness, Perceived Ease of Use, and User Acceptance of Information Technology, MIS Quarterly, Vol. 13, No. 3 (Sep., 1989), pp. 319-340 43
7. Assess Construct Validity (cont.) Fred D. Davis (1989), Perceived Usefulness, Perceived Ease of Use, and User Acceptance of Information Technology, MIS Quarterly, Vol. 13, No. 3 (Sep., 1989), pp. 319-340 44
Final Measurement Scales for Perceived Usefulness and Perceived Ease of Use Fred D. Davis (1989), Perceived Usefulness, Perceived Ease of Use, and User Acceptance of Information Technology, MIS Quarterly, Vol. 13, No. 3 (Sep., 1989), pp. 319-340 45
Final Measurement Scales for Perceived Usefulness and Perceived Ease of Use Fred D. Davis (1989), Perceived Usefulness, Perceived Ease of Use, and User Acceptance of Information Technology, MIS Quarterly, Vol. 13, No. 3 (Sep., 1989), pp. 319-340 46
Suggested Procedure for Developing Better Measures (Churchill, 1979) Recommended Coefficients or Techniques Procedure 1. Specify domain of the construct Literature search 2. Generate sample of Items Literature search Experience survey Insight stimulating examples Critical incidents Focus groups 3. Collect data Coefficient alpha Factor analysis 4. Purify measure 5. Collect data Coefficient alpha Split-half reliability 6. Assess reliability Multitrait-multimethod matrix Criterion validity 7. Assess validity 8. Develop norms Average and other statistics summarizing distribution of scores 8. Develop norms Source: (Churchill, 1979)(A Paradigm for Developing Better Measures of marketing Constructs) 47
8 Developing Norms A better way of assessing the position of the individual on the characteristic is to compare the person s score with the score achieved by other people. Norm quality is a function of both the number of cases on which the average is based and their representativeness. 48
Summary of Suggested Procedure for Developing Better Measures (Churchill, 1979) Researchers doing applied work and practitioners could at least be expected to complete the process through step 4. Marketing researchers are already collecting data relevant to steps 5-8. 49
Current Practice in Scale Development Churchill, G. A., Jr., (1979). A paradigm for developing better measures of marketing constructs. Journal of Marketing Research, 16(February), 64-73. Gerbing, D. W., & Anderson, J. C. (1988). An updated paradigm for scale development incorporating unidimensionality and its assessment. Journal of Marketing Research, 25(2), 186-192. DeVellis, R. F. (1991). Scale development: Theory and applications. Newbury Park, CA: Sage Publications. Spector, P. E. (1992). Summated rating scale construction: An introduction. Newbury Park, CA: Sage Publications. Netemeyer, R. G., Bearden, W. O., & Sharma, S. (2003). Scaling procedures: Issues and applications. Thousand Oaks, CA: Sage Publications. Clark R. A. (2006), Consumer Independence: Conceptualization, Measurement and Validation of a Previously Unmeasured Social Response Tendency, Ph.D. Dissertation, College of Business of The Florida State University. 50


