Binary Outcomes and Relationships in Observational Studies
Explore the framework of characterizing binary outcomes, the problem of interest events, and examples of binary data in various settings such as motor vehicle crashes and cholesterol levels. Understand the relationship between outcomes and independent variables using logistic models.
Download Presentation

Please find below an Image/Link to download the presentation.
The content on the website is provided AS IS for your information and personal use only. It may not be sold, licensed, or shared on other websites without obtaining consent from the author. If you encounter any issues during the download, it is possible that the publisher has removed the file from their server.
You are allowed to download the files provided on this website for personal or commercial use, subject to the condition that they are used lawfully. All files are the property of their respective owners.
The content on the website is provided AS IS for your information and personal use only. It may not be sold, licensed, or shared on other websites without obtaining consent from the author.
E N D
Presentation Transcript
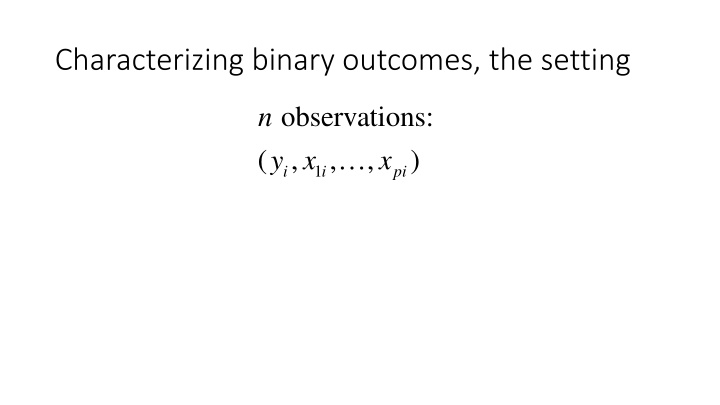
Characterizing binary outcomes, the setting observations: ( , , i i y x n , ) x 1 pi
Characterizing binary outcomes, the problem. 0 if the outcome of interest does not occur 1 if the event of interest does occur = iy What is the relationship b , ) and ( , i pi x x et we n e y 1 i We are interested in examining the relationship between a dichotomous outcome (dependent) variable and other (independent) variables.
Binary data, example. Suppose have observed a group of n drivers and noted their ages and which ones have been involved in a motor vehicle crash. th For the driver if they were not involved in a motor vehicle crash if they were involved in a motor vehicle crash x =drivers age i i 0 1 = y i We want to examine whether there is a significant relationship between the x and the y and perhaps whether the relationship takes a particular form. In particular, the logistic model. i i
Binary data, example. We select a group of n patients, draw blood, and determine their total cholesterol value. We observe them for 20 years and determine which ones develop coronary heart disease (CHD). th For the patient if they did not develop CHD if level of serum cholester i 0 1 = y i they dev eloped CHD x = o l i We want to examine whether there is a significant relationship between the x and the y and perhaps whether the relationship takes a particular form. In particular, the logistic model. i i
Point The list of binary outcomes and covariates goes on and on. But, the framework stays constant. 0 1 if the outcome of interest does not occur if the event of interest does occur = iy What is the relationship b , ) and ( , i pi x x et we n e y 1 i
The chd2018 data set. The Lipid2018 data set.
Examine Contents of chd2018 The position option prints the names of the variables in the order they appear in each row of the data set libname s5238 "d:\dropbox\sas\sasdata\5238"; proc proc contents contents data=s5238.chd2018 position; run run;
Print the first 25 records proc proc print print data=s5238.chd2018(obs=25 25);run run;
With no variables specified in a var statement, proc means produces output for all numeric variables on the data set proc proc means means data=s5238.chd2018; run run;
Examine values of character variables proc proc freq tables chd diab gender smoking; run run; freq data=s5238.chd2018;
Find out how many unique values are associated with each variable using the nlevels option proc freq proc proc freq tables age--chd/noprint; run run; freq data=s5238.chd2018 nlevels;


