Binomial Distribution in Probability Experiments
A binomial experiment follows 4 key requirements leading to a binomial distribution. Learn notation, formula, and examples of the binomial distribution's application in calculating probabilities of success in trials.

Download Presentation

Please find below an Image/Link to download the presentation.
The content on the website is provided AS IS for your information and personal use only. It may not be sold, licensed, or shared on other websites without obtaining consent from the author.If you encounter any issues during the download, it is possible that the publisher has removed the file from their server.
You are allowed to download the files provided on this website for personal or commercial use, subject to the condition that they are used lawfully. All files are the property of their respective owners.
The content on the website is provided AS IS for your information and personal use only. It may not be sold, licensed, or shared on other websites without obtaining consent from the author.
E N D
Presentation Transcript
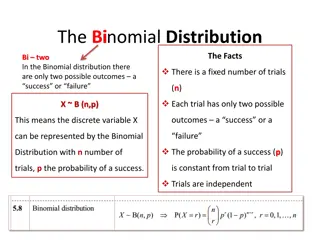
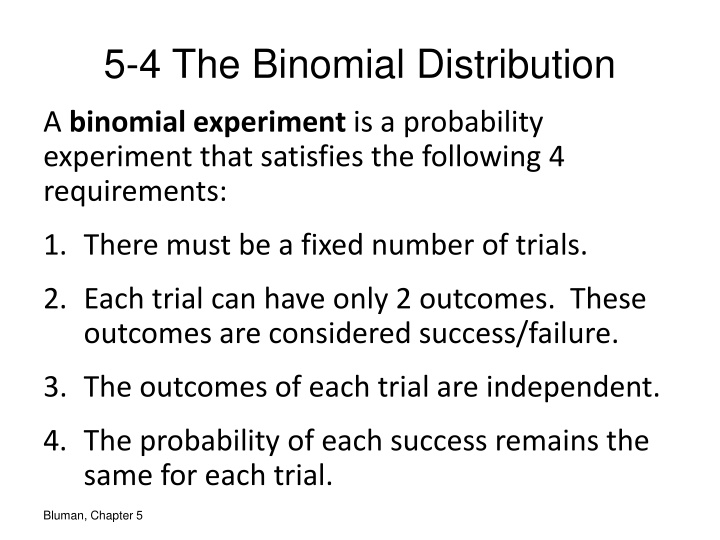
5-4 The Binomial Distribution A binomial experiment is a probability experiment that satisfies the following 4 requirements: 1. There must be a fixed number of trials. 2. Each trial can have only 2 outcomes. These outcomes are considered success/failure. 3. The outcomes of each trial are independent. 4. The probability of each success remains the same for each trial. Bluman, Chapter 5
The binomial experiment leads to a special type of distribution called the binomial distribution. The outcomes of a binomial experiment and the corresponding probabilities of these outcomes are called a binomial distribution. Bluman, Chapter 5
Notation for the Binomial Distribution 1. P(S) Probability of a success 2. P(F) Probability of a failure 3. p The numerical probability of a success 4. q The numerical probability of a failure 5. *P(S)=p, P(F)=1-p = q 6. n Number of trials 7. X Number of successes in n trials Bluman, Chapter 4 8. *Note 0 X n, X=0,1,2,3, ,n
Binomial Probability Formula In a binomial experiment, the probability of exactly X successes in n trials is ?! ? ? !?! ?? ?? ? ?(?)=
Example 5-15 A coin is tossed 3 times. Find the probability of getting exactly 2 heads. Is this Binomial? 1. There are fixed number of trials (3) 2. Two outcomes (heads or tails) 3. Outcomes are independent 4. Each time, the probability is 1 So, n=3, X=2, p=1 2 2 2, q=1 Bluman, Chapter 4
Example 5-15 (cont.) A coin is tossed 3 times. Find the probability of getting exactly 2 heads. n=3, X=2, p=1 2, q=1 2 3 2 !2! (1 4 1 2 8= ?.??? 3! 1 2)1 2)2 ( P(2 heads)=P(X=2)= = 3 1 = 3 Confirm answer with sample space (what we did before) we can get 2 heads 3 ways out of 8 total options. Bluman, Chapter 4
Example 5-16 A survey found 1/5 of Americans visit a doctor in a given month. If 10 people are randomly selected, find probability exactly 3 go to the doctor. Is this Binomial? 1. There are fixed number of trials (10) 2. Two outcomes (they go or they don t) 3. Outcomes are independent 4. Each time, the probability is 1 So, n=10, X=3, p=1 5 5, q=4 5 Bluman, Chapter 4
Example 5-16 (cont.) A survey found 1/5 of Americans visit a doctor in a given month. If 10 people are randomly selected, find probability exactly 3 go to the doctor. n=10, X=3, p=1 5, q=4 5 10 3 !3! (1 10! 4 5)7 5)3 ( P(3 visits)=P(X=3)= 125 16384 78125 1 = 120 = 1966080 9765625= ?.??? Bluman, Chapter 4
Example 5-17 A survey found 30% of teenage consumers receive money from part-time jobs. If 5 teens are selected at random, find the probability that 3 will have part-time jobs. Is this Binomial? 1. There are fixed number of trials (5) 2. Two outcomes (they have the job or they don t) 3. Outcomes are independent 4. Each time, the probability is 0.3 So, n=5, X=3, p=0.3, q=0.7 Bluman, Chapter 4
Example 5-17 (cont.) A survey found 30% of teenage consumers receive money from part-time jobs. If 5 teens are selected at random, find the probability that 3 will have part-time jobs. n=5, X=3, p=0.3, q=0.7 P(3 jobs)=P(X=3)= 5! 5 3 !3! (0.3)3 (0.7)2 = 10 .027 .49 = 0.1323 Bluman, Chapter 4
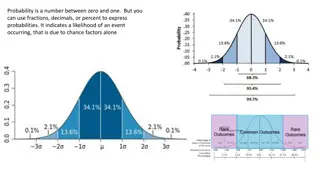
Analysis of Binomial Distribution The mean, variance, standard deviation of a variable that has the binomial distribution can be found using the following formulas. Mean: ? = ? ? Variance: ??= ? ? ? Standard Deviation: ? = ? ? ? 11 Bluman, Chapter 4
Example 5-21 A coin is tossed 4 times. Find the mean, variance and standard deviation of the # of heads. Verify these new formulas work. Use the formulas and n=4, p=1 2, q=1 2 ? = ? ? = 4 1 2= ? ??= ? ? ? = 4 1 2 1 2=4 4= ? ?2= ? = 1 = ? 12 Bluman, Chapter 4
Example 5-22 A die is rolled 480 times. Find the mean, variance and standard deviation of the # of 2 s rolled. This is binomial: success-get a 2, failure-don t n=480, p=1 6 ? = ? ? = 480 1 6= ?? ??= ? ? ? = 480 1 6, q=5 6 5 6=80 5 ??.? 6 ?2= ? = 66.7 ?.? 13 Bluman, Chapter 4
Example 5-22 (cont.) A die is rolled 480 times. Find the mean, variance and standard deviation of the # of 2 s rolled. On average, there will be 80 2 s. The standard deviation is 8.2. 14 Bluman, Chapter 4
Example 5-23 The Statistical Bulletin published by Metropolitan Life Insurance Co. reported that 2% of all American births result in twins. If a random sample of 8000 births is taken, find the mean, variance and standard deviation of # of births that would be twins. This is binomial: success-have twins, failure-don t n=8000, p=.02, q=.98 15 Bluman, Chapter 4
Example 5-23 (cont.) The Statistical Bulletin published by Metropolitan Life Insurance Co. reported that 2% of all American births result in twins. If a random sample of 8000 births is taken, find the mean, variance and standard deviation of # of births that would be twins. ? = ? ? = 8000(.02) = ??? ??= ? ? ? = 8000 .02 .98 = 160 .98 ???.? ?2= ? = 156.8 ??.? 16 Bluman, Chapter 4
Example 5-23 (cont.) The Statistical Bulletin published by Metropolitan Life Insurance Co. reported that 2% of all American births result in twins. If a random sample of 8000 births is taken, find the mean, variance and standard deviation of # of births that would be twins. For the sample, the average number of births that would result in twins is 160, the variance is around 157 and standard deviation is around 13. 17 Bluman, Chapter 4
Homework Part a - Pg. 263: 1, 3, 4ac, 7 Part b - Pg. 263: 14-17


")

")

")


")

")
")