Binomial Distributions in Probability Analysis
Explore the concept of Binomial Distributions in probability theory, including criteria for a binomial random variable, probability formulas, distribution examples, and practical applications. Learn how to calculate probabilities, use calculator notations, and interpret results for different scenarios.

Download Presentation

Please find below an Image/Link to download the presentation.
The content on the website is provided AS IS for your information and personal use only. It may not be sold, licensed, or shared on other websites without obtaining consent from the author. If you encounter any issues during the download, it is possible that the publisher has removed the file from their server.
You are allowed to download the files provided on this website for personal or commercial use, subject to the condition that they are used lawfully. All files are the property of their respective owners.
The content on the website is provided AS IS for your information and personal use only. It may not be sold, licensed, or shared on other websites without obtaining consent from the author.
E N D
Presentation Transcript
PROBABILITY Section 4.2: BINOMIAL DISTRIBUTIONS
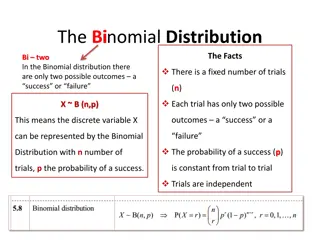
Objective: To be able to find binomial probabilities. Criteria for a Binomial Random Variable: 1. Each observation can be classified as a success or failure. 2. n is the number of trials and n is fixed. 3. p is the probability of success and p is fixed. 4. The observations are independent. Binomial Probability Formula: Let X be a binomial random variable and k be the number of successes. If X~B(n,p), then ? ??? (1 ?)(? ?)where ? ? ? ? = ? = ?! =???= ?! ? ? !which is called the binomial coefficient.
(1 - p) = q q represents the probability of failure. ? ??? ?(? ?)(revised with q) The binomial probability distribution is as follows: ? ? = ? = ? = ?? P(? = ??) 0 1 2 n ?? ?? ?? ?? Points regarding the binomial distribution: A binomial random variable is always discrete. To graph use a probability histogram. If p = 0.5 then the probability histogram will be bell-shaped. If p < 0.5 then the probability histogram will be skewed right. If p > 0.5 then the probability histogram will be skewed left. Notation: X~B(n,p)
Ex. A large shipment of toys contains 30% that are red, 40% that are blue and 30% that are yellow. Let X = the number of red toys. You select 5 toys at random. a. Does this example meet the criteria for a binomial setting? Explain. b. Find P(X = 0)
c. Find P(X = 1) d. Find P(X = 2) Calculator notation: For P(X = k) --- use binompdf(n,p,X) For P(X k) --- use binomcdf(n,p,X)
Using your calculator find the following a. P(X = 3) b. P(X = 4) c. P(X = 5) d. Create the probability distribution of X. Include the cumulative distribution. ? = ?? P(? = ??)
Ex. Let X = the number of successes and that X follows a binomial distribution with n = 11 and p = 0.72. Answer the following questions: a. P(X = 7) b. P(X < 7) c. P(X < 9) d. P(X < 9)
e. P(X < 6) f. P(X > 8) g. P(X > 7) h. P(X > 7) i. P(X > 10)
Ex. 7 couples buy new homes. It is known that in this large community 24% of new homes are built with electric heat. Let X = the number that choose electric heat. Find the probability that 3 couples choose electric heat. (show the formula that you would use) Find the probability that at most 1 couple chooses electric heat.
Find the probability that at least 3 couples choose electric heat. Find the probability that more than 3 couples choose electric heat. Binomial Means, Variance and Standard Deviations If the random variable X has a binomial distribution with n observations and the probability of success p, then the mean, variance and standard deviation of X are ? = ??, ?2= ??? ? = ??? and
Using this example again: Couples buy new homes. It is known that in this large community 24% of new homes are built with electric heat. Let X = the number that choose electric heat. What is the expected number of homes that choose electric heat? What is the standard deviation of the number of homes that choose electric heat?


 = q")

")


")